The company attributes its year-over-year record growth to its loyal clients and partners.
WINSTON-SALEM, NC / ACCESS Newswire / March 18, 2026 / ImageWorks Display® kicks off a yearlong celebration of its 30th anniversary, spotlighting the innovation, execution and collaboration that help retailers and brands improve store performance.
“Thirty years in – and the work continues,” said CEO Justin Raney. “This milestone reflects the trust our customers place in us and the high standard we set every day. We’re bringing smarter ideas, stronger execution and intentional design to meet evolving retail display needs.”
Throughout the anniversary year, ImageWorks will highlight its 2026 theme – “Driven to Innovate.”– with a focus on business solutions and product ideas that perform, partnerships that last and customer experiences that exceed expectations.
Anniversary highlights
Continuous improvement: Feature innovation spotlights with new ideas and practical improvements customers can immediately put to work.
Store performance: Share proven ways to lift store performance through customer appreciation and thought leadership events and content.
Capital investment: Commit to capability investments that strengthen design, manufacturing and support from product concept to installation completion.
Team recognition: Celebrate employees and our local community with initiatives that give back locally and recognize top talent.
CEO Raney emphasized the company’s purpose‑driven approach to the business. “We’re here to solve real challenges and deliver measurable value,” he said. “That means deliberate choices about quality, investment and growth so customers can move forward with confidence.”
Raney added, “We’re grateful for every collaboration. And the next 30 years will demand even more intention – from smarter ideas to stronger execution – so we can serve customers even better tomorrow than we do today.”
Founded in 1996, ImageWorks Display partners with retailers and consumer brands to design, engineer and manufacture stock and custom retail display solutions – from back bar to center store – with total‑store integration and end‑to‑end support. The company offers in‑stock Xulta back‑bar and Planniq center‑store fixtures alongside custom capabilities for whole‑store merchandising. ImageWorks serves convenience and grocery; specialty retail (including fast‑growing categories such as cannabis and sunglasses); and CPG brands across categories such as small appliances and electronics, DIY/home improvement, outdoor and pet. Learn more at imageworksdisplay.com.
News Release Contact Information:
Anne M. Berg | Vyway® Market & Brand Strategy Phone: 651-271-1111 Email: anne@vyway.com Address: Minneapolis, Minnesota
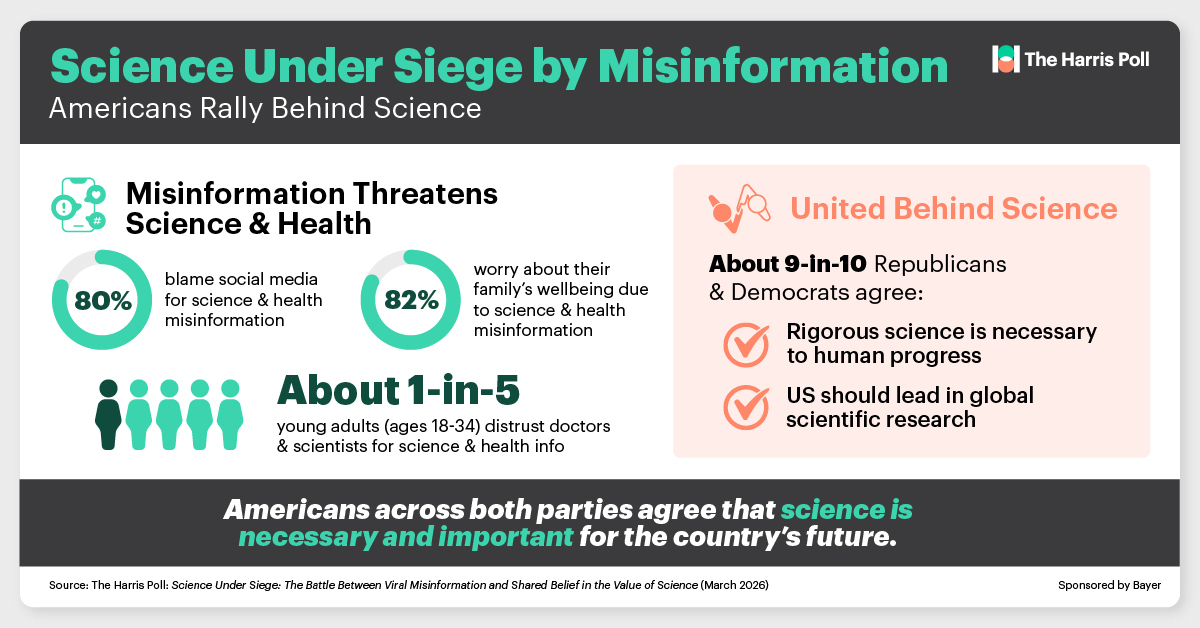
While a majority of Americans say misinformation about science has worsened, 9-in-10 Republicans and Democrats agree US should play leading role in global scientific research; only 1-in-5 believe US is leading versus China
Americans primarily point to businesses (23%) and non-profits (19%) to step in, if the government cannot fund scientific research
NEW YORK CITY, NY / ACCESS Newswire / March 18, 2026 / The Harris Poll, a Stagwell (NASDAQ:STGW) agency, announced today the results from a landmark survey, “Science Under Siege: The Battle Between Viral Misinformation and Shared Belief in the Value of Science,” sponsored by Bayer. The survey revealed a profound “misinformation paradox” at the heart of American life: while 80% of Americans blame social media for false or misleading health and science information in the media and online, these platforms are the public’s top source for such news.
Underpinning this issue is the emergence of a “headline-only” culture, underscored by a staggering 75% of Americans who admit to having shared articles related to health and science with someone they know in the past month based on the headline alone and without reading the full article first. The same poll found that 71% of Americans say that online content creators are very or somewhat to blame for misinformation about science and health.
Misinformation around health and science could be affecting trust in credible sources like doctors and scientists, particularly among young adults. The majority of young adults ages 18-34 (51%) rely on social media as their primary source of science and health information and nearly 1-in-5 distrust doctors (16%) and scientists (20%) as sources of information on health and science. Misinformation also carries an emotional toll: 83% of all Americans report feeling angry when encountering false or misleading information about science and health and 82% worry about their own well-being or the well-being of their families.
Despite these challenges, the data confirms the need for innovation to improve lives, with the majority of Americans across the political spectrum respecting scientists and agreeing rigorous science is necessary for continued human progress – a rare bipartisan consensus in a divided world.
“This is more than just busy social feeds full of click-bait headlines when half of young adults are scrolling for their health information,” said John Gerzema, CEO of The Harris Poll. “This growing paradox is going to have real life health impacts if a fifth of young people continue to distrust doctors and scientists as legitimate sources.”
Key findings from the report, Science Under Siege, include:
First, the Good News. There’s a Bipartisan Consensus on Trust in Science: Despite deep political divides, a remarkable 88% of Republicans and 92% of Democrats agree that rigorous science is necessary for continued human progress. This shared value is rooted in a deep respect for the scientific community; there is overwhelming agreement that scientists in the US today improve people’s quality of life (80% of Republicans and 90% of Democrats). Furthermore, 90% of Republicans and 92% of Democrats believe the US should play a leading role in global scientific research.
The Misinformation Paradox: 80% of Americans blame social media platforms for the spread of false or misleading information about science and health, and 75% are concerned about online content creators actively attacking or undermining scientific research and expertise. Yet, social media (32%) is the top primary source for health and science information, outpacing TV news (25%), newspapers/news websites/news apps (13%), AI (7%), government agencies (6%), and non-governmental organizations (2%).
A Generational Trust Gap: The survey found that 51% of young adults (ages 18-34) use social media as their primary source for science and health information. Nearly half of young adults blame doctors (48%) and scientists (43%) for providing false or misleading information, and about 1-in-5 distrust these traditional experts.
The Emotional Toll: Nearly 9-in-10 Americans (88%) are concerned with false or misleading information about science and health in the media and online. Large majorities of Americans are feeling angry (83%) and are worried about their well-being and the well-being of their families (82%) when encountering such information.
Anxiety Over US Science Leadership: Americans want to lead on science, but few actually believe the US is leading. Only 19% believe the US currently leads China in scientific research, while 33% believe the US is falling behind. If the government cannot fund scientific research, Americans primarily point to businesses (23%) and non-profits (19%) to step in.
“We’ve uncovered a hidden consensus,” said John Gerzema, CEO of The Harris Poll. “Despite a fractured delivery of information, a shared belief in the value of science has rare unity across party lines.”
Ultimately, the findings of “Science Under Siege” suggest that while the impacts of misinformation are alarming, Americans remain remarkably united in their support for science and its impacts for today and the future. The data reflects clear public support for science as an essential engine for securing the nation’s future progress.
The research was conducted online in the United States by The Harris Poll on behalf of Bayer among 2,023 US adults. The survey was conducted February 4th to 6th, 2026.
For complete research method, including weighting variables and subgroup sample sizes, please reach out to Kathy Steinberg at The Harris Poll.
About The Harris Poll
For more than 60 years, The Harris Poll has been a leader in social and market research, helping organizations navigate complexity and understand cultural change. From emerging technologies to generational values, Harris insights help leaders make data-driven decisions that build stronger brands and deeper connections.
About Stagwell
Stagwell is the global challenger network transforming marketing through AI. We deliver scaled creative performance for the world’s most ambitious brands, connecting culture-moving creativity with leading-edge technology to harmonize the art and science of marketing. Led by entrepreneurs, our specialists in 45+ countries are unified under a single purpose: to drive effectiveness and improve business results for our clients. Join us at www.stagwellglobal.com.
ICOTYDE is the first and only IL-23R targeted oral peptide that delivers complete skin clearance and a favorable safety profile in a once-daily pill
Approval supported by four phase 3 studies that met all primary endpoints and demonstrated a favorable safety profile in 2,500 patients
$50 million milestone payment triggered by FDA approval; Protagonist is eligible to receive 6 – 10% royalties on sales and up to $580 million in future milestone payments
Webcast and conference call to be held at 8:30 am ET on March 18
NEWARK, CA / ACCESS Newswire / March 18, 2026 / Protagonist Therapeutics, Inc. (NASDAQ:PTGX) (“Protagonist” or “the Company”) announced today that Johnson & Johnson received U.S. Food and Drug Administration (FDA) approval for ICOTYDE™ (icotrokinra), an interleukin-23 (IL-23) receptor antagonist for the treatment of moderate-to-severe plaque psoriasis in adults and pediatric patients 12 years of age and older who weigh at least 40 kg who are candidates for systemic therapy or phototherapy. ICOTYDE is the first and only targeted oral peptide that precisely blocks the IL-23 receptor.
ICOTYDE will be commercialized by Johnson & Johnson under the license and collaboration agreement established in 2017 between Protagonist and Janssen Biotech, Inc., a Johnson & Johnson company. ICOTYDE was jointly discovered by Protagonist and Johnson & Johnson scientists, with Protagonist having primary responsibility for the development of ICOTYDE through Phase 1, and Johnson & Johnson assuming responsibility for further development and commercialization.
FDA approval of ICOTYDE triggers a $50 million milestone payment to Protagonist. Protagonist is eligible to receive up to $580 million in potential additional regulatory and sales milestone payments, as well as tiered royalties ranging from 6% to 10% on global net sales, corresponding to 7.25% on a weighted-average basis at $4 billion in annual sales, with the top royalty tier of 10% applying to sales above $4 billion.
“ICOTYDE offers a novel plaque psoriasis treatment that combines the established efficacy and safety of IL-23 pathway blockade with the convenience of a once-daily oral pill. The FDA approval of ICOTYDE reflects a successful culmination of years of groundbreaking research and clinical development that began over 13 years ago in our laboratories and demonstrates the strength of our peptide technology platform to generate innovative therapies,” said Dinesh V. Patel, PhD, President and Chief Executive Officer of Protagonist Therapeutics. “I am incredibly proud of our team’s dedication and commitment to addressing unmet medical needs and making a meaningful difference in the lives of patients.”
“I would also like to congratulate Johnson & Johnson for maintaining a productive and seamless collaboration ongoing since 2017 as this novel medicine was advanced from discovery through development and finally to FDA approval,” Patel continued. “We look forward to results from ongoing clinical studies evaluating ICOTYDE in additional IL-23-driven diseases, including psoriatic arthritis, ulcerative colitis, and Crohn’s disease. With the pending FDA decision for rusfertide this year, and the financial resources for accelerating pipeline investment, we’re confident this is the beginning of a multi-year product-driven growth cycle for Protagonist Therapeutics.”
ICOTYDE was developed using Protagonist’s proprietary peptide technology platform. The Company continues to invest in its discovery engine and development pipeline, with multiple programs moving towards proof-of-concept trials designed to produce therapeutics with clinically relevant competitive differentiation.
Clinical evidence summary ICOTYDE met all primary endpoints and demonstrated a favorable safety profile across four Phase 3 studies including 2,500 patients. The approval is based on an unprecedented body of evidence from the ICONIC clinical development program, which simultaneously evaluated ICOTYDE in adults and adolescents, high impact sites such as scalp and genital PsO, and in duplicate head-to-head trials versus an active comparator. In the head-to-head studies, approximately 70% of patients achieved clear or almost clear skin (IGA 0/1) and 55% of patients achieved a Psoriasis Area and Severity Index (PASI)90 response at Week 16. Rates of adverse reactions for ICOTYDE treated patients were within 1.1% of placebo through Week 16 and no new safety signals were identified through Week 52.
Additional studies underway in other disease areas include: ICONIC-PsA 1 (NCT06878404) and ICONIC-PsA 2 (NCT06807424) in active psoriatic arthritis; ICONIC-UC (NCT071196748) in moderately to severely active ulcerative colitis; and ICONIC-CD (NCT7196722) in moderately to severely active Crohn’s disease.
Conference Call and Webcast Details The dial-in numbers for Protagonist’s investor update on March 18th at 8:30 am ET are: US-based Investors: 1-877-407-0752 International Investors: 1-201-389-0912 Conference Call ID: 13759426
A replay will be available on the Company’s Investor Relations Events and Presentations webpage following the event.
Unmet need in moderate to severe plaque psoriasis Psoriasis affects more than eight million Americans, impacting physical comfort and quality of life, especially when lesions are on visible or sensitive areas. For many with moderate to severe disease, targeted systemic treatments are key. This aligns with International Psoriasis Council guidance to transition to systemic therapy if two cycles of topical medications applied for four weeks fail to bring meaningful improvement.
About ICOTYDE™ (icotrokinra) ICOTYDE is the first and only targeted oral peptide designed to precisely block the IL-23 receptor, which underpins the inflammatory response in moderate to severe plaque PsO. ICOTYDE binds to the IL-23 receptor with high affinity and demonstrated potent inhibition of IL-23 signaling in human T cells. Clinical significance of these findings are unknown.
ICOTYDE is currently approved in the U.S. for the treatment of adults, and pediatric patients 12 years of age and older who weigh at least 40 kg, with moderate to severe plaque PsO who are candidates for systemic therapy or phototherapy. Patients on ICOTYDE take one pill, once a day with water upon waking, 30 minutes prior to eating food.
ICOTYDE is also currently in Phase 3 studies for active psoriatic arthritis, moderately to severely active ulcerative colitis and moderately to severely active Crohn’s disease.
FullICOTYDE™ prescribing information will be available on the ICOTYDE™ website.
About Plaque Psoriasis Plaque psoriasis (PsO) is a chronic immune-mediated disease resulting in overproduction of skin cells, which causes inflamed, scaly plaques that may be itchy or painful. It is estimated that 8 million Americans and more than 125 million people worldwide live with the disease. Nearly one-quarter of all people with plaque PsO have cases that are considered moderate to severe. On Caucasian skin, plaques typically appear as raised, red patches covered with a silvery white buildup of dead skin cells or scale. On skin of color, the plaques may appear darker and thicker, and more of a purple, gray, or dark brown color. Plaques can appear anywhere on the body, although they most often appear on the scalp, knees, elbows, and torso. Living with plaque PsO can be a challenge and impact life beyond a person’s physical health, including emotional health, relationships, and handling the stressors of life. Psoriasis on highly visible areas of the body or sensitive skin, such as the scalp, hands, feet, and genitals, can have an increased negative impact on quality of life.
About Protagonist Protagonist Therapeutics is a discovery through late-stage development biopharmaceutical company. The Company’s proprietary peptide technology platform enables de novo discovery of peptide therapeutics. Two novel peptides derived from Protagonist’s proprietary discovery platform are at or near commercialization. ICOTYDE™ (icotrokinra) is approved in the U.S. for the treatment of moderate-to-severe plaque psoriasis in adults and pediatric patients 12 years of age and older who weigh at least 40 kg who are candidates for systemic therapy or phototherapy. ICOTYDE is the first and only targeted oral peptide that precisely blocks the Interleukin-23 receptor (IL-23R) licensed to Janssen Biotech, Inc.,a Johnson & Johnson company. ICOTYDE was jointly discovered by Protagonist and Johnson & Johnson scientists, with Protagonist having primary responsibility for the development of ICOTYDE through Phase 1, and Johnson & Johnson assuming responsibility for further development and commercialization. An NDA for rusfertide, a first-in-class hepcidin mimetic peptide that is being co-developed with Takeda Pharmaceuticals pursuant to a worldwide license and collaboration agreement entered in 2024, is under priority review with the FDA. Protagonist holds an option to co-commercialize rusfertide in the U.S. through a 50/50 profit and loss share structure or can opt-out of this structure. The Company also has a number of preclinical stage drug discovery programs addressing clinically and commercially validated targets including an oral IL-17 peptide antagonist, obesity dual and triple agonists, an oral hepcidin functional mimetic, and the recently announced IL-4 and amylin programs.
More information on Protagonist, its pipeline drug candidates, and clinical studies can be found on the Company’s website at https://www.protagonist-inc.com.
Cautionary Note on Forward-Looking Statements This press release contains forward-looking statements for purposes of the safe harbor provisions of the Private Securities Litigation Reform Act of 1995. Forward-looking statements include statements regarding the potential benefits of ICOTYDE and potential revenue from the Company’s collaboration with Johnson & Johnson. In some cases, you can identify these statements by forward-looking words such as “anticipate,” “believe,” “may,” “will,” “expect,” or the negative or plural of these words or similar expressions. Forward-looking statements are not guarantees of future performance and are subject to risks and uncertainties that could cause actual results and events to differ materially from those anticipated, including, but not limited to, our ability to develop and commercialize our product candidates, our ability to earn milestone payments under our collaboration agreements with Janssen and Takeda, our ability to use and expand our programs to build a pipeline of product candidates, our ability to obtain and maintain regulatory approval of our product candidates, our ability to operate in a competitive industry and compete successfully against competitors that have greater resources than we do, and our ability to obtain and adequately protect intellectual property rights for our product candidates. Additional information concerning these and other risk factors affecting our business can be found in our periodic filings with the Securities and Exchange Commission, including under the heading “Risk Factors” contained in our most recently filed periodic reports on Form 10-K and Form 10-Q filed with the Securities and Exchange Commission. Forward-looking statements are not guarantees of future performance, and our actual results of operations, financial condition, and liquidity, and the development of the industry in which we operate, may differ materially from the forward-looking statements contained in this press release. Any forward-looking statements that we make in this press release speak only as of the date of this press release. We assume no obligation to update our forward-looking statements, whether as a result of new information, future events, or otherwise, after the date of this press release.
Abinand Rangesh, CEO of Tecogen, commented “during the upcoming call, I will provide some significant positive updates that will include the scale of the Vertiv opportunity pipeline for our chillers, the status of our own data center opportunities and an upcoming pilot project.
On other positive news, our revenue grew 20% year on year. Although our loss widened and cash burn increased, this was because of critical expenses needed to expand margins in the service business and to develop the data center opportunities including expanding manufacturing capacity, R&D on our data center dual power source chiller and marketing.”
NORTH BILLERICA, MA / ACCESS Newswire / March 17, 2026 / Tecogen Inc. (NYSE American:TGEN), a leading manufacturer of clean energy products, reported revenues of $27.07 million and net loss of $8.25 million for the year December 31, 2025 compared to $22.62 million and net loss of $4.76 million for the same period in 2024, an increase in revenues of 19.7% year over year. For the quarter ending December 31, 2025, revenues were $5.32 million and net loss of $3.99 million compared to revenues of $6.08 million, and a net loss of $1.19 million in 2024. We used $9.91 million in cash from operations, used $0.40 million in cash to acquire property plant and equipment, principally the improvements required at our North Billerica facility, and generated $17.40 million in cash from financing activities during the year ended December 31, 2025 due to the July 2025 follow-on offering. Our cash balance was $12.43 million at December 31, 2025.
Key Takeaways
Net Loss and Earnings Per Share
Net loss for the quarter ended December 31, 2025 was $3.99 million compared to a net loss of $1.19 million for the same period of 2024, an increase of $2.81 million, due to the impairment of goodwill and long-lived assets, increased operating expenses and decreased gross profit from our Services segments. EPS for the quarters ended December 31, 2025 and 2024 was a loss of $0.13/share and $0.05/share, respectively.
Net loss for the year ended December 31, 2025 was $8.25 million compared to a net loss of $4.76 million in 2024, an increase of $3.49 million, due to decreased gross profit for our Services segment due to increased labor and material costs, increased operating costs and the goodwill and long-lived asset impairment recognized in the year ended December 31, 2025. EPS for the years ended December 31, 2025 and 2024 was a loss of $0.30/share and $0.19, respectively.
Loss from Operations
Loss from operations for the quarter ended December 31, 2025 was $4.14 million compared to a loss from operations of $1.14 million for the same period in 2024, an increase of $3.00 million, due to the impairment of goodwill and long-lived assets, increased operating expenses and decreased gross profit from our Services segments.
Loss from operations for the year ended December 31, 2025 was $8.24 million compared to a loss from operations of $4.53 million for the same period in 2024, an increase of $3.71 million, due to the impairment of goodwill and long-lived assets, increased operating expenses and decreased gross profit from our Services segments.
Revenues
Revenues for the quarter ended December 31, 2025 were $5.32 million compared to $6.08 million for the same period in 2024, a 12.5% decrease.
Products revenues in the quarter ended December 31, 2025 were $0.46 million compared to $1.44 million for the same period in 2024, a decrease of 68.1%. The decrease in revenue during the quarter ended December 31, 2025 is due to a reduction in chiller and cogeneration revenue.
Services revenues in the quarter ended December 31, 2025 were $4.46 million, compared to $4.08 million for the same period in 2024, an increase of 9.3% due to a $0.36 million increase in revenues from existing contracts and a $0.01 million increase in revenues from the acquired Aegis maintenance contracts.
Energy Production revenues in the quarter ended December 31, 2025 were $395 thousand compared to $550 thousand for the same period in 2024, an decrease of 28.3%. The decrease in Energy Production revenue is due to the expiration of contracts late in 2024 and decreased run hours at certain energy production sites.
Revenues for the year ended December 31, 2025 were $27.07 million compared to $22.62 million for the same period in 2024, an increase of 19.7% year over year.
Products revenues in the year ended December 31, 2025 were $9.13 million compared to $4.44 million for the same period in 2024 an increase of 105.5%. The increase in revenue during the year ended December 31, 2025 is due to increased chiller and cogeneration sales. The relocation to our new facility in April 2024 constrained our manufacturing capacity, which impacted product revenues during the second and third quarters of 2024.
Services revenues in the year ended December 31, 2025 were $16.62 million compared to $16.07 million for the same period in 2024, an increase of 3.4%. The increase in revenue during the year ended December 31, 2025 is due to the addition of $0.82 million in revenues from existing contracts, offset by a $0.27 million decrease in revenue from Aegis maintenance contracts.
Energy Production revenues in the year ended December 31, 2025 were $1.32 million, compared to $2.10 million for the same period in 2024, a decrease of 37.0%. The decrease in Energy Production revenue is due to the expiration of contracts late in 2024 and decreased run hours at certain energy production sites.
Gross Profit
Gross profit for the quarter ended December 31, 2025 was $1.96 million compared to $2.73 million in the same period in 2024. Gross margin decreased to 36.8% in the quarter ended December 31, 2025 compared to 45.0% for the same period in 2024. The decrease in gross margin was driven by increased labor and material costs in our Services segment, increased labor cost in our Products segment and lower Energy Production margins.
Gross profit for the year ended December 31, 2025 was $9.82 million compared to $9.87 million in the same period of 2024. Gross margin decreased to 36.3% in the year ended December 31, 2025 compared to 43.6% for the same period in 2024. The decrease in gross margin was driven by increased labor and material costs in our Services segment and lower Energy Production margins in the year ended December 31, 2025.
Operating Expenses
Operating expenses increased $2.22 million, or 57.4%, to $6.10 million in the quarter ended December 31, 2025 compared to $3.87 million in the same period in 2024, due to the $1.11 million goodwill and long-lived asset impairment and increases in payroll, benefits, recruitment costs, freight costs and sales commissions.
Operating expenses increased $3.67 million, or 25.4%, to $18.07 million in the year ended December 31, 2025 compared to $14.40 million in the same period in 2024 due to the $1.11 million goodwill and long-lived asset impairment and increases in payroll, benefits, recruitment costs, freight costs and sales commissions.
Adjusted EBITDA was negative $2.43 million for the quarter ended December 31, 2025 compared to negative $0.69 million for the quarter ended December 31, 2025. Adjusted EBITDA was negative $5.64 million for the year ended December 31, 2025 compared to negative $3.63 million for the year ended December 31, 2025. (Adjusted EBITDA is defined as net income or loss attributable to Tecogen, adjusted for interest, income taxes, depreciation and amortization, stock-based compensation expense, unrealized gain or loss on investment securities, goodwill impairment charges and other non-cash non-recurring charges or gains including abandonment of intangible assets and asset impairment. See the table following the Condensed Consolidated Statements of Operations for a reconciliation from net income (loss) to Adjusted EBITDA, as well as important disclosures about the Company’s use of Adjusted EBITDA).
Conference Call Scheduled for March 18, 2026, at 9:30 am ET
Tecogen will host a conference call on March 18, 2026 to discuss the fourth quarter results beginning at 9:30 am eastern time. To listen to the call please dial (877) 407-7186 within the U.S. and Canada, or +1 (201) 689-8052 from other international locations. Participants should ask to be joined to the Tecogen Fourth Quarter and Year-End 2025 earnings call. Please begin dialing 10 minutes before the scheduled starting time. The earnings press release will be available on the Company website at www.Tecogen.com in the “News and Events” section under “About Us.” The earnings conference call will be webcast live. To view the associated slides, register for and listen to the webcast, go to https://ir.tecogen.com/ir-calendar. Following the call, the recording will be archived for 14 days.
The earnings conference call will be recorded and available for playback one hour after the end of the call. To listen to the playback, dial (877) 660-6853 within the U.S. and Canada, or (201) 612-7415 from other international locations and use Conference Call ID#: 13752231.
About Tecogen
Tecogen Inc. designs, manufactures, sells, installs, and maintains high efficiency, ultra-clean, cogeneration products including engine-driven combined heat and power, air conditioning systems, and high-efficiency water heaters for residential, commercial, recreational and industrial use. The company provides cost effective, environmentally friendly and reliable products for energy production that nearly eliminate criteria pollutants and significantly reduce a customer’s carbon footprint. In business for over 35 years, Tecogen has shipped more than 3,200 units, supported by an established network of engineering, sales, and service personnel in key markets in North America. For more information, please visit www.tecogen.com or contact us for a free Site Assessment.
Forward Looking Statements
This press release and any accompanying documents, contain “forward-looking statements” which may describe strategies, goals, outlooks or other non-historical matters, or projected revenues, income, returns or other financial measures, that may include words such as “believe,” “expect,” “anticipate,” “intend,” “plan,” “estimate,” “project,” “target,” “potential,” “will,” “should,” “could,” “likely,” or “may” and similar expressions intended to identify forward-looking statements. These statements are only predictions and involve known and unknown risks, uncertainties, and other factors that may cause our actual results to differ materially from those expressed or implied by such forward-looking statements. Given these uncertainties, you should not place undue reliance on these forward-looking statements. Forward-looking statements speak only as of the date on which they are made, and we undertake no obligation to update or revise any forward-looking statements.
In addition to those factors described in our Annual Report on Form 10-K, our Quarterly Reports on Form 10-Q and on our Current Reports on Form 8-K, under “Risk Factors”, among the factors that could cause actual results to differ materially from past and projected future results are the following: fluctuations in demand for our products and services, competing technological developments, issues relating to research and development, the availability of incentives, rebates, and tax benefits relating to our products and services, changes in the regulatory environment relating to our products and services, integration of acquired business operations, and the ability to obtain financing on favorable terms to fund existing operations and anticipated growth.
In addition to GAAP financial measures, this press release includes certain non-GAAP financial measures, including adjusted EBITDA which excludes certain expenses as described in the presentation. We use Adjusted EBITDA as an internal measure of business operating performance and believe that the presentation of non-GAAP financial measures provides a meaningful perspective of the underlying operating performance of our current business and enables investors to better understand and evaluate our historical and prospective operating performance by eliminating items that vary from period to period without correlation to our core operating performance and highlights trends in our business that may not otherwise be apparent when relying solely on GAAP financial measures.
Tecogen Media & Investor Relations Contact Information:
TECOGEN INC. CONSOLIDATED BALANCE SHEETS (unaudited)
ASSETS
December 31, 2025
December 31, 2024
Current Assets
Cash and cash equivalents
$
12,430,287
$
5,405,233
Accounts receivable, net
4,280,991
6,026,545
Unbilled revenue
138,020
398,898
Inventory, net
10,949,697
9,634,005
Prepaid and other current assets
1,086,310
680,565
Total current assets
28,885,305
22,145,246
Property, plant and equipment, net
1,609,321
1,738,036
Right of use assets – operating leases
1,490,094
1,730,358
Right of use assets – finance leases
1,434,080
452,390
Intangible assets, net
2,146,503
2,513,189
Goodwill
1,248,442
2,346,566
Other assets
176,358
166,474
TOTAL ASSETS
$
36,990,103
$
31,092,259
LIABILITIES AND STOCKHOLDERS’ EQUITY
Current liabilities:
Related party notes payable
$
–
$
1,548,872
Accounts payable
3,381,545
4,142,678
Accrued expenses
2,814,150
2,890,886
Deferred revenue, current
1,530,977
6,701,131
Operating lease obligations, current
538,641
430,382
Finance lease obligations, current
280,265
85,646
Acquisition liabilities, current
677,162
902,552
Unfavorable contract liabilities, current
44,433
113,449
Total current liabilities
9,267,173
16,815,596
Long-term liabilities:
Deferred revenue, net of current portion
3,265,886
1,165,951
Operating lease obligations, net of current portion
1,004,488
1,341,789
Finance lease obligations, net of current portion
992,285
325,235
Acquisition liabilities, net of current portion
826,757
1,008,760
Unfavorable contract liability, net of current portion
160,902
309,390
Total liabilities
15,517,491
20,966,721
Commitments and contingencies
–
–
Stockholders’ equity:
Tecogen Inc. stockholders’ equity:
Common stock, $0.001 par value; 100,000,000 shares authorized; 29,846,479 issued and outstanding at December 31, 2025 and 24,950,261 shares issued and outstanding at December 31, 2024
29,847
24,950
Additional paid-in capital
78,216,467
57,845,289
Unearned compensation
(712,019
)
–
Accumulated deficit
(55,888,649
)
(47,639,894
)
Total Tecogen Inc. stockholders’ equity
21,645,646
10,230,345
Noncontrolling interest
(173,034
)
(104,807
)
Total stockholders’ equity
21,472,612
10,125,538
TOTAL LIABILITIES AND STOCKHOLDERS’ EQUITY
$
36,990,103
$
31,092,259
TECOGEN INC. CONSOLIDATED STATEMENTS OF OPERATIONS (unaudited)
Three Months Ended
December 31, 2025
December 31, 2024
Revenues
Products
$
460,522
$
1,441,909
Services
4,462,823
4,083,492
Energy production
394,652
550,121
Total revenues
5,317,997
6,075,522
Cost of sales
Products
492,219
995,921
Services
2,527,701
2,009,762
Energy production
340,669
335,392
Total cost of sales
3,360,589
3,341,075
Gross profit
1,957,408
2,734,447
Operating expenses
General and administrative
4,090,960
2,928,287
Selling
585,163
503,145
Research and development
307,426
226,843
Gain on disposition of assets
(1,250
)
(4,111
)
Goodwill impairment
1,113,129
217,295
Total operating expenses
6,095,428
3,871,459
Loss from operations
(4,138,020
)
(1,137,012
)
Other income (expense)
Other income (expense), net
90,409
(11,509
)
Interest expense
(38,697
)
(30,762
)
Gain on sale of marketable securities
3,687
–
Unrealized gain on marketable securities
85,988
–
Total other income (expense), net
141,387
(42,271
)
Loss before provision for state income taxes
(3,996,633
)
(1,179,283
)
Provision for state income taxes
–
465
Consolidated net loss
(3,996,633
)
(1,179,748
)
Loss (income) attributable to the non-controlling interest
2,853
(6,319
)
Loss attributable to Tecogen Inc.
$
(3,993,780
)
$
(1,186,067
)
Net loss per share – basic
$
(0.13
)
$
(0.05
)
Net loss per share – diluted
$
(0.13
)
$
(0.05
)
Weighted average shares outstanding – basic
29,839,305
24,893,739
Weighted average shares outstanding – diluted
29,839,305
24,893,739
Three Months Ended
December 31, 2025
December 31, 2024
Non-GAAP financial disclosure (1)
Net loss attributable to Tecogen Inc.
$
(3,993,780
)
$
(1,186,067
)
Interest expense, net
38,697
30,762
Income taxes
–
465
Depreciation & amortization, net
256,145
134,039
EBITDA
(3,698,938
)
(1,020,801
)
Stock-based compensation
138,171
41,082
Gain on sale of marketable securities
(3,687
)
–
Unrealized gain on marketable securities
(85,988
)
–
Inventory write down
110,488
70,530
Goodwill and long-lived asset impairment
1,113,129
217,295
Adjusted EBITDA
$
(2,426,825
)
$
(691,894
)
TECOGEN INC. CONSOLIDATED STATEMENTS OF OPERATIONS (unaudited)
Years Ended
December 31, 2025
December 31, 2024
Revenues
Products
$
9,133,450
$
4,443,996
Services
16,616,523
16,074,870
Energy production
1,323,737
2,100,670
Total revenues
27,073,710
22,619,536
Cost of sales
Products
6,097,501
3,014,655
Services
10,202,774
8,432,876
Energy production
948,927
1,301,832
Total cost of sales
17,249,202
12,749,363
Gross profit
9,824,508
9,870,173
Operating expenses:
General and administrative
13,522,035
11,356,406
Selling
2,267,247
1,880,903
Research and development
1,166,744
961,837
Loss (gain) on sale of assets
183
(12,181
)
Long-lived asset impairment
15,005
–
Goodwill impairment
1,098,124
217,295
Total operating expenses
18,069,338
14,404,260
Loss from operations
(8,244,830
)
(4,534,087
)
Other income (expense)
Interest and other income (expense)
151,711
(26,814
)
Interest expense
(150,289
)
(90,304
)
Gain on the sale of marketable securities
3,687
–
Unrealized gain on marketable securities
10,993
–
Total other expense, net
16,102
(117,118
)
Loss before income taxes
(8,228,728
)
(4,651,205
)
State income tax provision
20,615
22,565
Consolidated net loss
(8,249,343
)
(4,673,770
)
Loss (income) attributable to the noncontrolling interest
588
(86,468
)
Net loss attributable to Tecogen Inc.
$
(8,248,755
)
$
(4,760,238
)
Net loss per share – basic
$
(0.30
)
$
(0.19
)
Net loss per share – diluted
$
(0.30
)
$
(0.19
)
Weighted average shares outstanding – basic
27,233,143
24,861,190
Weighted average shares outstanding – diluted
27,233,143
24,861,190
Years Ended
December 31, 2025
December 31, 2024
Non-GAAP financial disclosure (1)
Net income loss attributable to Tecogen Inc.
$
(8,248,755
)
$
(4,760,238
)
Interest expense
150,289
90,304
Provision for income taxes
20,615
22,565
Depreciation & amortization, net
877,675
553,783
EBITDA
(7,200,176
)
(4,093,586
)
Stock-based compensation
348,029
172,987
Realized gain on marketable securities
(3,687
)
–
Unrealized gain on marketable securities
(10,993
)
–
Inventory writedown
110,488
70,530
Goodwill and long-lived asset impairment
1,113,129
217,295
Adjusted EBITDA
$
(5,643,210
)
$
(3,632,774
)
(1) Non-GAAP Financial Measures
In addition to reporting net income, a U.S. generally accepted accounting principle (“GAAP”) measure, this news release contains information about Adjusted EBITDA (net income (loss) attributable to Tecogen Inc adjusted for interest, income taxes, depreciation and amortization, stock-based compensation expense, unrealized gain or loss on investment securities, goodwill impairment charges and other non-cash non-recurring charges including abandonment of certain intangible assets), which is a non-GAAP measure. The Company believes Adjusted EBITDA allows investors to view its performance in a manner similar to the methods used by management and provides additional insight into its operating results. Adjusted EBITDA is not calculated through the application of GAAP. Accordingly, it should not be considered as a substitute for the GAAP measure of net income and, therefore, should not be used in isolation of, but in conjunction with, the GAAP measure. The use of any non-GAAP measure may produce results that vary from the GAAP measure and may not be comparable to a similarly defined non-GAAP measure used by other companies.
TECOGEN INC. CONSOLIDATED STATEMENTS OF CASH FLOWS (unaudited)
For the Years Ended
December 31, 2025
December 31, 2024
CASH FLOWS FROM OPERATING ACTIVITIES:
Consolidated loss
$
(8,249,343
)
$
(4,673,770
)
Adjustments to reconcile net loss to net cash used in operating activities:
Depreciation, accretion and amortization, net
877,675
553,783
Loss (gain) on sale of assets
183
(12,181
)
Provision for credit losses
62,958
146,010
Provision for inventory reserve
110,488
70,530
Unrealized gain on investment securities
(10,993
)
–
Gain on the sale of investments
(3,687
)
–
Stock-based compensation
348,029
172,987
Goodwill and long-lived asset impairment
1,113,129
217,295
Non-cash interest expense
43,476
45,025
Changes in operating assets and liabilities:
(Increase) decrease in:
Accounts receivable
1,682,596
608,929
Inventory, net
(1,426,182
)
848,884
Unbilled revenue
260,879
859,634
Prepaid expenses and other current assets
(405,745
)
(319,926
)
Other non-current assets
464,576
510,723
Increase (decrease) in:
Accounts payable
(761,131
)
(371,736
)
Accrued expenses
(76,736
)
386,257
Deferred revenue
(3,070,219
)
5,850,265
Other current liabilities
(871,627
)
(832,162
)
Net cash provided by (used in) operating activities
(9,911,674
)
4,060,547
CASH FLOWS FROM INVESTING ACTIVITIES:
Purchases of property and equipment
(400,781
)
(969,163
)
Proceeds on sale of property and equipment
4,290
51,400
Distributions to noncontrolling interest
(67,639
)
(96,974
)
Net used in investing activities
(464,130
)
(1,014,737
)
CASH FLOWS FROM FINANCING ACTIVITIES:
Proceeds from follow-on offering, net of transaction costs
18,105,100
–
(Repayment of) proceeds from related party note
(1,076,956
)
1,000,000
Finance lease principal payments
(324,065
)
(62,847
)
Proceeds from exercise of stock options
696,779
71,000
Net cash provided by financing activities
17,400,858
1,008,153
Change in cash and cash equivalents
7,025,054
4,053,963
Cash and cash equivalents, beginning of the year
5,405,233
1,351,270
Cash and cash equivalents, end of the year
$
12,430,287
$
5,405,233
Supplemental disclosure of cash flow information:
Cash paid for interest
$
183,354
$
45,278
Cash paid for taxes
$
20,615
$
22,565
Non-cash investing activities
Right-of-use assets acquired under operating leases
According to data from a new peer-reviewed, real-world study, the “standard” Semen Analysis test can come back “normal” and still miss problems that affect a couple’s chances of getting pregnant.
SALT LAKE CITY, UT / ACCESS Newswire / March 17, 2026 / According to Path Fertility™, a newly published, peer-reviewed study in the Journal of Assisted Reproduction and Genetics reports that a routine Semen Analysis can return “normal” results while still missing sperm-quality issues that may affect whether some common fertility treatments work.
As a result, this reality about the “Standard of Care” Semen Analysis tests used by most fertility clinics and doctors belies the emerging data that such tests were not designed to provide all the information needed to make informed decisions, says Andy Olson, Path Fertility’s CEO and Co-Founder.
“This new study reinforces what so many couples experience firsthand: a ‘normal’ Semen Analysis doesn’t always come with all the answers,” Olson said. “In fact, our review of the clinical data shows that up to 25% of men with a ‘normal’ Semen Analysis result have sperm that are incapable of producing a healthy pregnancy without intervention via advanced fertility techniques.”
PHOTO CAPTION: Andy Olson, Chief Executive Officer and Co-Founder of Path Fertility. March 2026
As shown in the JARG article, the study analyzed outcomes from 537 couples treated at 10 U.S. fertility clinics and evaluated results from an epigenetic sperm-quality test alongside treatment outcomes.
In the study’s real-world dataset, researchers reported a clear pattern: when men had an Abnormal result on the epigenetic sperm-quality test, no pregnancies were recorded from intrauterine insemination (placing prepared sperm into the uterus around the time of ovulation) in the outcomes captured.
By contrast, outcomes for in vitro fertilization (a process where eggs are retrieved and fertilized in a lab) using intracytoplasmic sperm injection (a common technique where a clinician injects a single sperm into an egg to help fertilization occur) did not show a meaningful difference based on the epigenetic result.
“Let me be clear: this does not mean fertility doctors are doing anything wrong,” added Kristin Brogaard, Ph.D., Path Fertility’s Chief Science Officer and Co-Founder. “Semen Analysis is the accepted Standard of Care in addressing infertility issues, and it provides important information about sperm count, movement, and shape.
“The challenge, however, is that the Semen Analysis test was not designed to directly measure how well sperm function in the steps required for conception. We believe that couples deserve clear information so they can have better conversations with their clinicians about what to try next.”
PHOTO CAPTION: Kristin Brogaard, Ph.D., Chief Science Officer and Co-Founder of Path Fertility. March 2026
What Semen Analysis Can Show and What it Cannot
A Semen Analysis is widely used in fertility care because it helps clinicians assess basic sperm parameters, including how many sperm are present, how they move, and how they look.
But a Semen Analysis does not directly answer the question most couples care about the most:
Can these sperm successfully do the work required to create a pregnancy, especially with less-invasive treatments like intrauterine insemination?
In fact, most fertility professionals acknowledge that some sperm can appear “normal” with a Semen Analysis test while still struggling with key functions required for conception, including:
Finding the egg,
Binding to the egg,
Penetrating the egg, and
Fertilizing the egg.
What the JARG Study Evaluated, in Plain English
The JARG study focused on a sperm test based on epigenetics, which is a way scientists study chemical markers that help regulate how genes behave. Epigenetics do not change DNA itself. In fact, in sperm, these markers can reflect whether sperm are more or less likely to function as needed for conception.
The JARG report follows two additional peer-reviewed studies published in 2023 in F&S Science and in Frontiers in Genetics, respectively, which align with the JARG report’s central takeaway – that Semen Analysis alone may miss important sperm-quality factors in some couples.
VIDEO CAPTION – Path Fertility’s “SpermQT vs. Standard Semen Analysis: What’s the Difference?” video, which can be found on YouTube here – https://www.youtube.com/watch?v=nQDm7hngzBk.
SpermQT™, offered by Path Fertility, is designed to complement Semen Analysis by adding this additional layer of information about sperm quality and function.
Why this Matters for Couples Struggling with Infertility
Many couples spend months or years cycling through uncertainty after being told that tests look “normal,” even when pregnancy does not happen.
The takeaway for mainstream readers is straightforward: a normal Semen Analysis result is not always the end of the male-fertility conversation.
This new JARG study adds real-world evidence that additional sperm-quality information may help couples and clinicians set expectations earlier, particularly when deciding whether to keep trying intrauterine insemination or consider moving sooner to more advanced approaches such as in vitro fertilization.
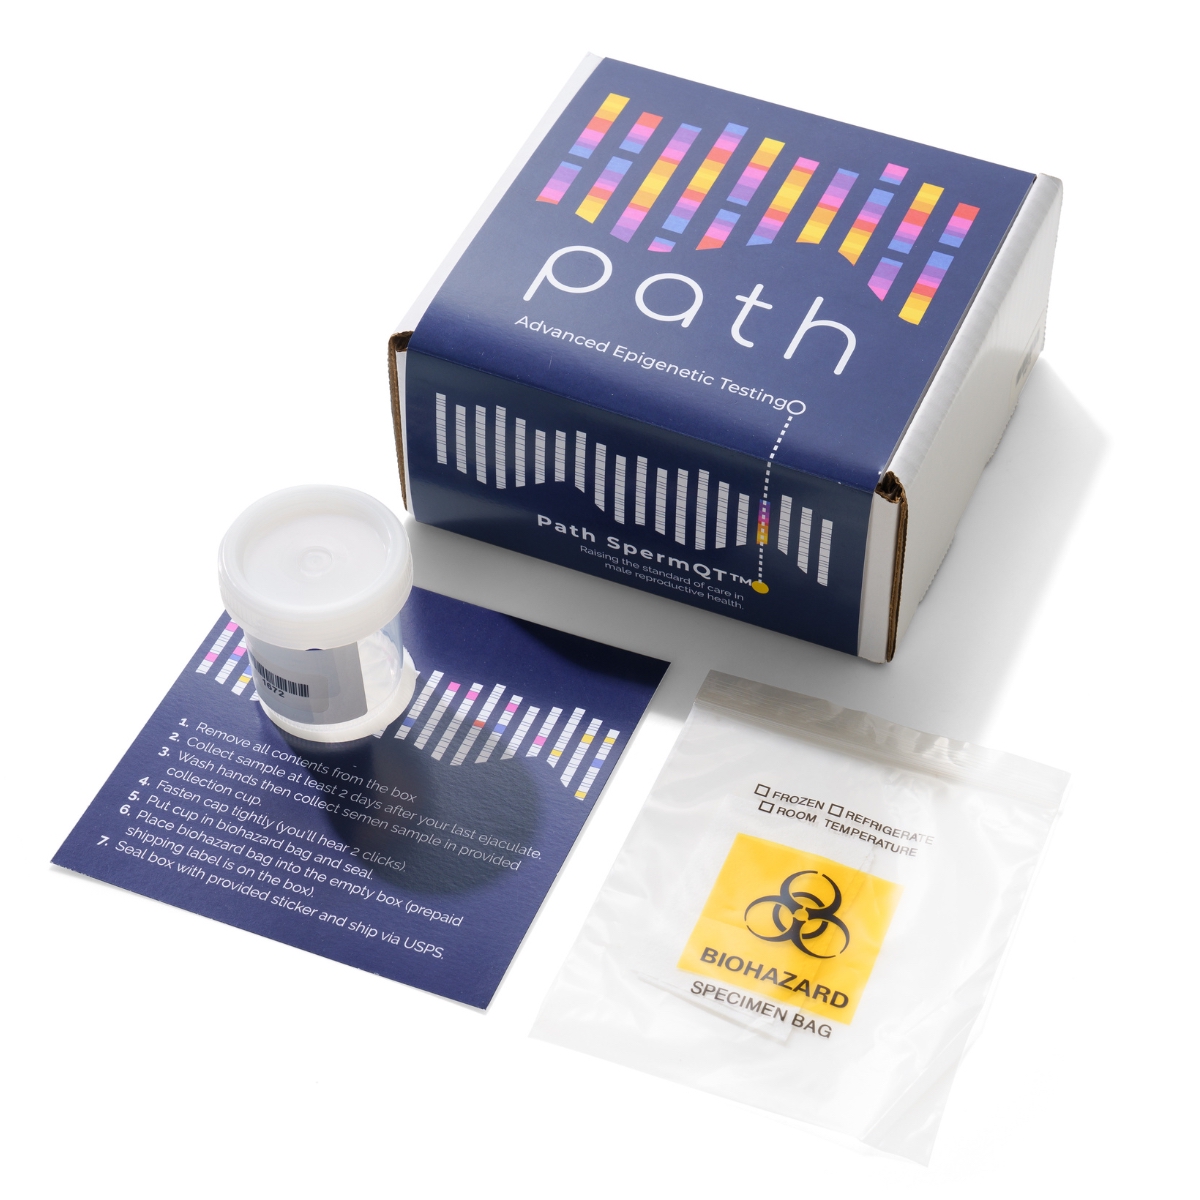
PHOTO CAPTION: The at-home version of the SpermQT test from Path Fertility. March 2026
Responsible Interpretation
This JARG study reports real-world associations across clinics and treatments, but it does not tell any individual couple what they should do.
Patients should discuss testing and treatment options with a qualified clinician who can consider the full medical picture of both partners.
About Path Fertility and SpermQT
Path Fertility is focused on raising the standard of care in male fertility by providing deeper insight into sperm quality and function. SpermQT is a sperm quality test based on epigenetic DNA-markers and is designed to complement Semen Analysis by adding information related to sperm function.
NOTE: Published Studies Referenced in this Release
Path Fertility, SpermQT and Path Fertility logos are each trademarks of Inherent Biosciences, Inc. All other trademarks are property of their respective owners.
SALT LAKE CITY, UT / ACCESS Newswire / March 17, 2026 / Path FertilityTM, an epigenetics-driven fertility technology company, today unveiled its SpermQTTM Facts Sheet, a copy of which is embedded below within this news release.
BEGINNING OF Path Fertility’s SpermQT Facts Sheet.
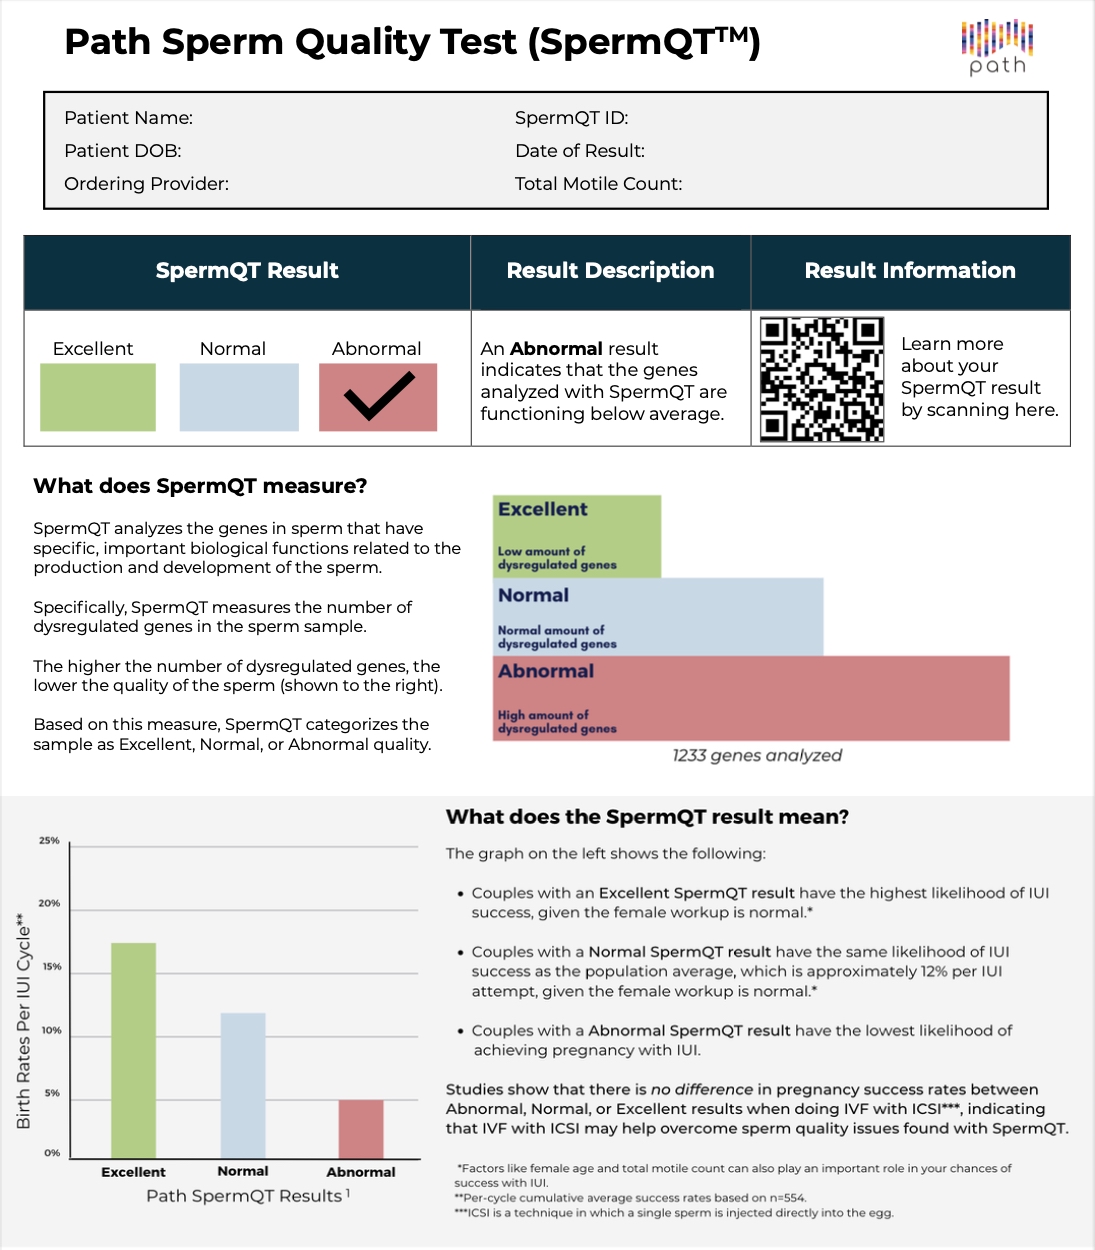
SpermQTIntroduction
SpermQT is a clinically validated epigenetic sperm quality test from Path Fertility designed to help answer a practical question in fertility care: Are sperm likely to function well enough to support pregnancy, even when Semen Analysis results look “Normal”?
Traditional Semen Analysis testing is still the “Standard of Care” in fertility circles. It measures sperm count, movement, and shape. Conversely, SpermQT adds an additional layer of insight by analyzing sperm DNA methylation patterns associated with sperm function, i.e., the presence of certain DNA abnormalities in sperm.
The Problem Addressed
Many couples spend months making decisions based on incomplete information about male fertility. Common patterns include:
Semen Analysis comes back “Normal,” but pregnancy still does not happen;
A couple is labeled “unexplained infertility” and treatment escalates without more clear male-factor insights;
Couples repeat time-consuming cycles and procedures without better diagnostics to guide next steps; and
Decisions around intrauterine insemination (IUI) are made with limited ability to predict success.
PHOTO CAPTION: SpermQT overview page from Path Fertility. March 2026
Couples that Can Benefit from SpermQT
SpermQT is especially relevant for:
Couples exploring fertility options that want better clarity earlier in the process;
Couples diagnosed with unexplained infertility, including cases with “Normal” Semen Analysis results;
Couples considering intrauterine insemination (IUI), a procedure where prepared sperm is placed into the uterus during ovulation;
Couples that need clearer guidance on what to do after experiencing failed IUIs; and
Healthcare professionals and providers seeking a more complete initial male fertility workup beyond Semen Analysis alone.
What SpermQT Measures
SpermQT analyzes epigenetic patterns (DNA methylation) in sperm. These patterns are associated with the biological steps sperm must complete to support pregnancy, often described as:
Find an egg,
Bind to an egg,
Penetrate an egg, and
Fertilize an egg.
SpermQT evaluates DNA methylation dysregulation across 1,200+ genes linked to sperm function.
SpermQT results are delivered in three categories:
Excellent
Normal
Abnormal
Key Takeaways, in Plain English
SpermQT is designed to add functional insight that Semen Analysis does not measure.
An Abnormal SpermQT result can provide a signal that sperm function may be contributing to infertility, even when Semen Analysis results are listed as “Normal.”
SpermQT is positioned as an early, complementary test to help guide decision-making around IUI planning and next-step conversations.
Key Clinical Insights
A review of the clinical data shows that SpermQT is positioned to help in three specific ways –
Prediction for IUI planning: Published clinical data reports statistically significant differences in pregnancy and live birth outcomes across SpermQT result tiers in IUI settings.
Identifying “hidden” male-factor risk missed by Semen Analysis tests: Path Fertility states that many Abnormal SpermQT results occur in men whose semen parameters appear normal on Semen Analysis, including the commonly cited “4 out of 5” framing.
IVF with ICSI context: Published findings suggest that in certain datasets, IVF with ICSI may reduce or overcome outcome differences associated with Abnormal SpermQT results.
In Vitro Fertilization (IVF): eggs are retrieved and fertilized in a lab, then an embryo is transferred to the uterus.
Conversely, Intracytoplasmic Sperm Injection (ICSI): a technique used with IVF where a single sperm is injected directly into an egg.
When to Use SpermQT (Practical Guidance)
Consider SpermQT when:
Semen Analysis results are Normal but pregnancy is not happening;
IUIs have failed and you need more insight into whether to continue IUI or move forward;
Clearer guidance is needed before investing time and money into IUI cycles; and
A more complete male-factor picture is desired earlier in the fertility workup.
{NOTE: SpermQT is not a replacement for Semen Analysis. It is intended to complement the traditional “Standard of Care” available via traditional Semen Analysis with functional insights.}
How It Works
Sample collected, followed by
→ Lab analysis of sperm DNA methylation patterns → SpermQT tier result (Excellent, Normal, Abnormal) → Patient and provider use results to inform next steps, including IUI planning and whether IVF options should be discussed
SpermQT Ordering and Pricing
SpermQT is physician ordered, with samples collected at home or in a clinic, with results typically available within 2 weeks.
Cash-pay Price: $385
With Semen Analysis bundle: $499
{NOTE: Many organizations cover the cost of SpermQT tests through their insurance/benefits programs. Couples faced with infertility challenges are encouraged to check with their insurance providers and/or Human Resources representative(s) to learn more.}
PHOTO CAPTION: The SpermQT at-home test from Path Fertility. March 2026
END OF Path Fertility’s SpermQT Facts Sheet AND COMPLETION OF THE NEWS RELEASE BELOW
About Path Fertility and SpermQT
Path Fertility is focused on raising the “Standard of Care” in male fertility by providing deeper insight into sperm quality and function. As such, SpermQT is a sperm quality test based on epigenetic DNA-markers and is designed to complement Semen Analysis by adding new information related to sperm function.
Path Fertility, SpermQT, and the Path Fertility logos are trademarks of Inherent Biosciences, Inc. All other trademarks are property of their respective owners.
Senate Candidate Challenges Incumbent in District 28 with Focus on Safety and Accountability
NEW YORK, NY AND MIAMI, FL / ACCESS Newswire / March 15, 2026 / TGI Group (OTC:TSPG), a leader in sustainable technology and innovative development, is pleased to announce that its specialized digital marketing subsidiary, AdBuzz, on behalf of Alina Bonsell, candidate for New York State Senate in District 28. Representing Manhattan’s East Side, Bonsell joins a growing movement of leaders focused on safety, economic recovery, and accountable governance.
“‘We win together’ isn’t just a slogan,” says Bonsell. “At the end of the day, we all want the same basic things: safe streets, protected communities, opportunity for our families, and leadership that actually listens.”
In Manhattan politics, races are often framed through party labels. But New York State Senate candidate Alina Bonsell, who is challenging longtime incumbent Liz Krueger in District 28, says voters on the East Side are thinking about something much simpler.
District 28 covers Manhattan’s East Side, Central Park South, and Roosevelt Island neighborhoods that Bonsell says represent some of the very best of New York.
“When communities are strong and safe, this part of Manhattan thrives,” she says. “We have some of the best schools, hospitals, and cultural institutions anywhere in the world. This district should be leading the way in unity.”
For Bonsell, that means putting her neighborhood first, community first, East Side first.
“Leadership should reflect the people who live here,” she says. “Right now, many residents feel that leadership in Albany has failed them miserably when it comes to protecting the character and safety of our neighborhoods.”
Before entering politics, Bonsell spent more than fifteen years working in the healthcare and pharmaceutical industry. She says that experience taught her how complex systems work and how policy decisions affect everyday life.
“In healthcare and business, outcomes matter,” she says. “You can’t hide behind ideology. Policies either help people or they don’t.”
Public safety is at the center of Bonsell’s campaign.
“Safety is not partisan,” she says. “Families want their children walking to school safely. Seniors want to feel comfortable in their neighborhoods. Businesses want streets where customers feel secure.”
Economic policy is another major focus.
“Small businesses are the lifeblood of Manhattan neighborhoods,” Bonsell says. “They want less bureaucracy, fair terms, and a real chance to thrive and succeed.”
Her platform also includes targeted tax relief for young adults starting their careers, working parents, and seniors, groups she says are increasingly squeezed by New York’s cost of living.
“Government should reward hard work, not penalize success,” she says.
Bonsell has also been outspoken about policies she believes push the city in the wrong direction.
“When I talk about policies that penalize success, I’m referring to the socialist direction from Mayor Mamdani that’s being imposed on New Yorkers,” she says. “Many residents feel these ideas are being pushed without enough concern for how they affect neighborhoods and opportunity.”
Despite running as a Republican in a heavily Democratic district, Bonsell insists the campaign is about broader principles.
“This race isn’t about left versus right,” she says. “It’s about whether our communities are safe, our small businesses can survive, and if our children will have the same opportunities we had.”
Her campaign slogan “We Win Together” captures a united message that focuses on safety, opportunity, and strong neighborhoods so everyone benefits.
About Alina Bonsell:
Alina Bonsell is a healthcare professional and community advocate running for New York State Senate in District 28. Her campaign is focused on restoring safety, transparency, and economic vitality to Manhattan’s East Side.
More information about Bonsell’s campaign platform can be found at alinabonsell.com
Strategic Digital Footprint
Advent Buzz will utilize its research and technology infrastructure to execute high-impact, consistent communication across digital and global platforms. By collaborating closely with campaign leadership, Advent Buzz ensures that Bonsell’s message reaches a diverse electorate spanning from East 14th Street to East 96th Street, including Roosevelt Island and Central Park South.
About Advent Buzz & TGI Solar Power Group
Advent Buzz is the research and digital marketing arm of TGI Solar Power Group, providing strategic foresight on global trends in technology, energy, and corporate communication.
TGI Solar Power Group Inc. (OTC: TSPG) is a diversified holding company dedicated to acquiring innovative patented technologies and creating sustainable habitats that enhance quality of life while respecting the planet. Safe Harbor & Forward-Looking Statements This announcement contains forward-looking statements within the meaning of the “safe harbor” provisions of the U.S. Private Securities Litigation Reform Act of 1995. These statements are based on the current expectations of management and are subject to risks and uncertainties. Actual results may differ. TGI undertakes no obligation to update these statements.
The nationally syndicated program is sponsored by featured television commercials from CISO Global (NASDAQ:CISO), Roadzen (NASDAQ:RDZN), Stardust Power (NASDAQ:SDST), DataVault AI (NASDAQ:DVLT), and YY Group (NASDAQ:YYGH).
NEW YORK CITY, NY / ACCESS Newswire / March 16, 2026 / New to The Street, the long-running national business television series, announces its upcoming Bloomberg Television broadcast scheduled for Friday, March 21, 2026, at 6:30 PM EST across the United States, Latin America, and the Middle East and North Africa (MENA). The program will feature interviews and company profiles highlighting innovative companies and emerging growth stories across multiple sectors.
The March 21 broadcast will showcase the following featured companies and segments:
FreeCast Inc. (NASDAQ:CAST) – A leading digital streaming platform providing consumers access to aggregated streaming television services and content through a unified interface.
KLED.AI – An artificial intelligence platform focused on next-generation AI infrastructure and advanced data intelligence tools designed to enhance enterprise analytics and digital transformation.
PetVivo Holdings, Inc. (OTCQB:PETV) – A biomedical device company focused on medical therapeutics for animals, including its proprietary SPRYNG™ osteoarthritis treatment used by veterinarians nationwide.
EmpowerLit – A platform dedicated to empowering individuals and organizations through literacy, education, and digital learning initiatives.
BlackBarn NYC Restaurant – A celebrated New York dining destination known for its farm-to-table culinary experience and vibrant hospitality concept.
Sponsored television commercials featured during the broadcast include:
CISO Global (NASDAQ:CISO) – A global leader in cybersecurity and enterprise security solutions.
Roadzen (NASDAQ:RDZN) – An AI-powered insurance and mobility technology company transforming the auto insurance ecosystem.
Stardust Power (NASDAQ:SDST) – A lithium refinery developer focused on strengthening domestic battery supply chains in the United States.
DataVault AI (NASDAQ:DVLT) – A data monetization and artificial intelligence platform specializing in structured data management and tokenized digital assets.
YY Group Holding Limited (NASDAQ:YYGH) – A technology platform connecting businesses with flexible workforce solutions and digital services.
The program airs weekly as sponsored programming on Bloomberg Television and the FOX Business Network, while interviews are distributed across the powerful digital ecosystem of New to The Street, including its rapidly growing YouTube platform and social media channels.
Companies interested in appearing on New to The Street can inquire about upcoming broadcast opportunities. John@NewtoTheStreet.com
New to The Street is one of the longest-running business television brands, broadcasting nationwide since 2009 and featuring innovative public and private companies across major networks including Bloomberg Television and FOX Business. The platform combines national television exposure, digital media distribution, predictable earned media, and powerful social media reach to highlight emerging growth companies and industry leaders to a global audience.
May 2025 Optimised Scoping Study (OSS) outlined a compelling Tunkillia development project:[1]
Annual production: ~120,000oz gold and ~250,000oz silver
Total LoM operating cash: ~A$2.7 billion (unlevered, pre-tax)
Net Present Value (NPV7.5%): ~A$1.4 billion (unlevered, pre-tax)
Internal Rate of Return (IRR): ~73.2% (unlevered, pre-tax); and
Payback period: ~0.8 years (unlevered, pre-tax)
Barton expediting Tunkillia toward Mining Lease (ML) application, with AUD gold and silver prices now over $2,000/oz and $60/oz higher (respectively) than used for OSS revenue estimates1
18,900m ‘Phase 1′ reverse circulation (RC) Resource upgrade drilling infilled high value S1 / S2 pit areas with broad high-grade intersections, supporting rapid payback in early ‘Starter pit’2; ~30,000m ‘Phase 2′ RC upgrade drilling now underway targeting balance of optimised open pits;
Phase 2 RC drilling a key step to support JORC (2012) Mineral Resource upgrades and target JORC (2012) Ore Reserves, a pre-feasibility study (PFS), and an ML application by end of 2026
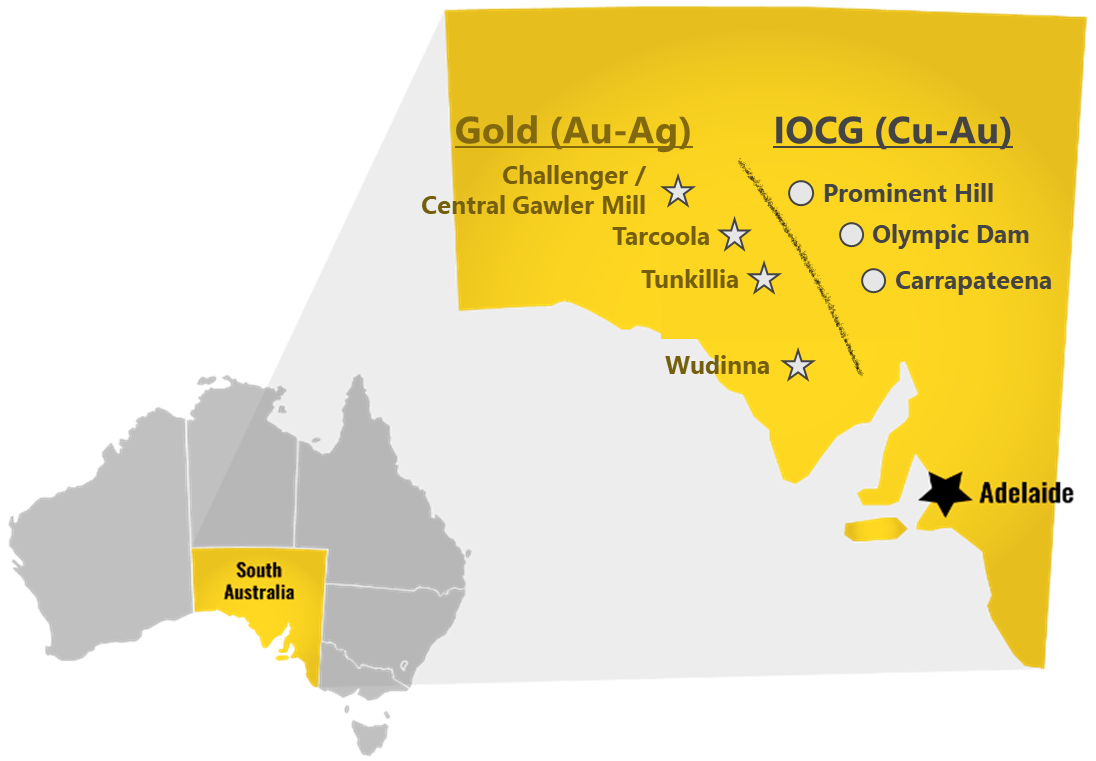
ADELAIDE, AU / ACCESS Newswire / March 15, 2026 / Barton Gold Holdings Limited (ASX:BGD)(OTCQB:BGDFF)(FRA:BGD3) (Barton or Company) is pleased to announce the start of ‘Phase 2′ JORC (2012) Mineral Resource upgrade drilling at its South Australian Tunkillia Gold Project (Tunkillia). Strike Drilling has been engaged to complete a program totalling ~30,000m.
Tunkillia’s Phase 2 RC upgrade drilling follows a successful ‘Phase 1’ program which infilled the high-value early ‘S1’ and ‘S2′ pit areas, modelled to produce ~$1.3 billion operating profit during the first 2.5 years of operation, with broad, high-grade intersections. Barton is targeting conversion of all of Tunkillia’s OSS modelled open pit mineralisation to JORC (2012) ‘Measured’ and ‘Indicated’ categories to accelerate financing and development.2
Full details can be accessed in the complete announcement on the ASX website or directly by clicking here.
Commenting on Tunkillia’s ongoing development drilling programs, Barton MD Alexander Scanlon said:
“The Tunkillia OSS demonstrated the financial and capital leverage available to large-scale bulk processing operations, with the major advantage of a higher-grade ‘Starter Pit’ that can pay back development costs 2x over in the first year – assuming A$5,000/oz gold and A$50/oz silver prices. At current gold and silver prices, Tunkillia would be modelled to produce over $1 billion operating profit in the first year, and over $2 billion operating profit in the first two years.
“Our recent ‘Phase 1’ Resource upgrade drilling results further confirmed the mineralisation behind these compelling economics; we are therefore now executing the balance of Tunkillia development drilling programs on an expedited timeline, targeting declared JORC Ore Reserves, a robust PFS, and a Mining Lease application by the end of 2026.
“Following the submission of our Mining Lease application, we will expedite Tunkillia’s project finance discussions and work with all key stakeholders including the South Australian Government to bring Tunkillia online as soon as possible. This project can generate substantial economic benefits for Barton and all of our stakeholders, including the State.”
1 Refer to ASX announcement dated 5 May 2025
2 Refer to ASX announcements dated 2 / 16 December 2025 and 21 January 2026
Authorised by the Managing Director of Barton Gold Holdings Limited.
About Barton Gold Barton Gold is an ASX, OTCQB and Frankfurt Stock Exchange listed Australian gold developer targeting future gold production of 150,000ozpa with 2.2Moz Au & 3.1Moz Ag JORC Mineral Resources (79.9Mt @ 0.87g/t Au), brownfield mines, and 100% ownership of the region’s only gold mill in the renowned Gawler Craton of South Australia.*
Challenger Gold Project
313koz Au + fully permitted Central Gawler Mill (CGM)
Tarcoola Gold Project
20koz Au in fully permitted open pit mine near CGM
Tolmer discovery grades up to 84g/t Au & 17,600g/t Ag
Competent Persons Statement & Previously Reported Information The information in this announcement that relates to the historic Exploration Results and Mineral Resources as listed in the table below is based on, and fairly represents, information and supporting documentation prepared by the Competent Person whose name appears in the same row, who is an employee of or independent consultant to the Company and is a Member or Fellow of the Australasian Institute of Mining and Metallurgy (AusIMM), Australian Institute of Geoscientists (AIG) or a Recognised Professional Organisation (RPO). Each person named in the table below has sufficient experience which is relevant to the style of mineralisation and types of deposits under consideration and to the activity which he has undertaken to quality as a Competent Person as defined in the JORC Code 2012 (JORC).
*Refer to Barton Prospectus dated 14 May 2021 and ASX announcement dated 8 September 2025. Total Barton JORC (2012) Mineral Resources include 1,049koz Au (39.7Mt @ 0.82 g/t Au) in Indicated category and 1,186koz Au (40.2Mt @ 0.92 g/t Au) in Inferred category, and 3,070koz Ag (34.5Mt @ 2.80 g/t Ag) in Inferred category as a subset of Tunkillia gold JORC (2012) Mineral Resources.
Activity
Competent Person
Membership
Status
Tarcoola Mineral Resource (Stockpiles)
Dr Andrew Fowler (Consultant)
AusIMM
Member
Tarcoola Mineral Resource (Perseverance Mine)
Mr Ian Taylor (Consultant)
AusIMM
Fellow
Tarcoola Exploration Results (until 15 Nov 2021)
Mr Colin Skidmore (Consultant)
AIG
Member
Tarcoola Exploration Results (after 15 Nov 2021)
Mr Marc Twining (Employee)
AusIMM
Member
Tunkillia Exploration Results (until 15 Nov 2021)
Mr Colin Skidmore (Consultant)
AIG
Member
Tunkillia Exploration Results (after 15 Nov 2021)
Mr Marc Twining (Employee)
AusIMM
Member
Tunkillia Mineral Resource
Mr Ian Taylor (Consultant)
AusIMM
Fellow
Challenger Mineral Resource (above 215mRL)
Mr Ian Taylor (Consultant)
AusIMM
Fellow
Challenger Mineral Resource (below 90mRL)
Mr Dale Sims
AusIMM / AIG
Fellow / Member
Wudinna Mineral Resource (Clarke Deposit)
Ms Justine Tracey
AusIMM
Member
Wudinna Mineral Resource (all other Deposits)
Mrs Christine Standing
AusIMM / AIG
Member / Member
The information relating to historic Exploration Results and Mineral Resources in this announcement is extracted from the Company’s Prospectus dated 14 May 2021 or as otherwise noted, available from the Company’s website at www.bartongold.com.au or on the ASX website www.asx.com.au. The Company confirms that it is not aware of any new information or data that materially affects the Exploration Results and Mineral Resource information included in previous announcements and, in the case of estimates of Mineral Resources, that all material assumptions and technical parameters underpinning the estimates, and any production targets and forecast financial information derived from the production targets, continue to apply and have not materially changed. In accordance with ASX Listing Rule 5.19.2, the Company further confirms that the material assumptions underpinning any production targets and the forecast financial information derived therefrom continue to apply and have not materially changed. The Company confirms that the form and context in which the applicable Competent Persons’ findings are presented have not been materially modified from the previous announcements.
Cautionary Statement Regarding Forward-Looking Information
This document may contain forward-looking statements. Forward-looking statements are often, but not always, identified by the use of words such as “seek”, “anticipate”, “believe”, “plan”, “expect”, “target” and “intend” and statements than an event or result “may”, “will”, “should”, “would”, “could”, or “might” occur or be achieved and other similar expressions. Forward-looking information is subject to business, legal and economic risks and uncertainties and other factors that could cause actual results to differ materially from those contained in forward-looking statements. Such factors include, among other things, risks relating to property interests, the global economic climate, commodity prices, sovereign and legal risks, and environmental risks. Forward-looking statements are based upon estimates and opinions at the date the statements are made. Barton undertakes no obligation to update these forward-looking statements for events or circumstances that occur subsequent to such dates or to update or keep current any of the information contained herein. Any estimates or projections as to events that may occur in the future (including projections of revenue, expense, net income and performance) are based upon the best judgment of Barton from information available as of the date of this document. There is no guarantee that any of these estimates or projections will be achieved. Actual results will vary from the projections and such variations may be material. Nothing contained herein is, or shall be relied upon as, a promise or representation as to the past or future. Any reliance placed by the reader on this document, or on any forward-looking statement contained in or referred to in this document will be solely at the readers own risk, and readers are cautioned not to place undue reliance on forward-looking statements due to the inherent uncertainty thereof.
NEW CANAAN, CT / ACCESS Newswire / March 13, 2026 / Network‑1 Technologies, Inc. (NYSE American:NTIP) (“Network‑1”), a company specializing in the acquisition, development, licensing and monetization of its intellectual property assets, today announced financial results for the year ended December 31, 2025.
Network‑1 had revenue of $150,000 for the year ended December 31, 2025 as compared to revenue of $100,000 for the year ended December 31, 2024. Revenue in both 2025 and 2024 was from settlement agreements in litigations involving Network‑1’s Remote Power Patent. Network‑1’s operating expenses decreased by $265,000 in 2025 compared to 2024, primarily due to decreased professional fees and general and administrative expenses.
Interest and dividend income for 2025 was $1,844,000 as compared to $1,897,000 for 2024. In addition, in 2025 Network‑1 recorded realized and unrealized gains on marketable securities of $277,000 as compared to $177,000 in 2024.
Network‑1 reported a net loss of $2,420,000 or $0.11 per share, basic and diluted, for the year ended December 31, 2025, compared to a net loss of $3,034,000 or $0.13 per share, basic and diluted, for the year ended December 31, 2024. Included in net loss is Network‑1’s share of the net loss of its equity method investee, ILiAD Biotechnologies, of $1,603,000 and $1,912,000 for the years ended 2025 and 2024, respectively.
In June 2025, Network-1 commenced patent litigation against Samsung Electronics Co., LTD and Samsung Electronics America, Inc.(collectively, “Samsung”) in the United States District Court for the Eastern District of Texas for infringement of certain patents in its M2M/IoT Patent Portfolio. The lawsuit alleges that Samsung infringes the asserted patents by supporting certain eSIM (embedded Subscriber Identification Module) and 5G technologies in its mobile devices, including its Galaxy smartphones, watches and tablets. A trial date has been scheduled for June 2027.
In September 2025, Network-1 commenced patent litigation on behalf of HFT Solutions, LLC, a wholly-owned subsidiary of Network-1, against Optiver US LLC and Optiver Trading US LLC in the U.S. District Court for the Western District of Texas, for infringement of certain patents in our HFT Patent Portfolio. A trial date has been scheduled for June 2027. The patents being asserted in this case are the same patents being asserted in our patent infringement cases against Citadel Securities, LLC and Jump Trading, LLC in the U.S. District Court for the Northern District of Illinois brought in December 2024.
On February 5, 2026, ILiAD Biotechnologies, Inc. completed a $115,000,000 preferred stock financing. The financing was led by RA Capital Management with participation from new investors Janus Henderson Investors and BNP Paribas Asset Management Alts, as well as existing investors including a multi-national pharmaceutical company and AI Life Sciences.Following the closing of the financing, Network-1 owned approximately3.1% of the outstanding shares on a non-fully diluted basis and approximately 2.5% of the outstanding shares on a fully diluted basis. As a result of the closing of the financing and the conversion to a corporation, Network-1 will no longer account for its investment in ILiAD using the equity method of accounting and will use the fair value method of accounting.
At December 31, 2025, Network‑1’s principal sources of liquidity consisted of cash, cash equivalents and marketable securities of $36,869,000 and working capital of $36,336,000. Management believes that based on Network‑1’s current cash, cash equivalents and marketable securities positions, Network‑1 will have sufficient liquidity to fund its operations for the foreseeable future.
Network‑1’s dividend policy consists of semi‑annual cash dividends of $0.05 per share ($0.10 per share annually) which have been paid in March and September of each year. In 2025, Network‑1 continued to declare and pay dividends consistent with its dividend policy. Network‑1’s dividend policy undergoes a periodic review by its Board of Directors and is subject to change at any time depending upon Network‑1’s earnings, financial requirements and other factors existing at the time.
In June 2025, the Board of Directors of Network-1 authorized an extension and increase of its share repurchase program (“Share Repurchase Program”) to repurchase up to $5,000,000 of shares of its common stock over the subsequent 24 month period. During the year ended December 31, 2025, Network‑1 repurchased an aggregate of 212,262 shares of its common stock at a cost of approximately $286,617 (exclusive of commissions) or an average price per share of $1.35. Since inception of its Share Repurchase Program (August 2011) to December 31, 2025, Network‑1 has repurchased an aggregate of 10,586,494 shares of its common stock at a cost of approximately $20,269,971 (exclusive of commissions). Combined with the approximately $24,300,000 in dividends paid beginning in 2010 through December 31, 2025, Network‑1 has returned, through such dividends and share repurchases, in excess of $44,500,000 to its shareholders.
ABOUT NETWORK‑1 TECHNOLOGIES, INC.
Network-1 Technologies, Inc. is engaged in the acquisition, development, licensing and protection of its intellectual property and proprietary technologies. Network-1 works with inventors and patent owners to assist in the development and monetization of their patented technologies. Network-1 currently owns one-hundred nineteen (119) U.S. patents and fifteen (15) international patents covering various technologies, including enabling technology for authenticating and using eSIM technology in Internet of Things (“IoT”) Machine-to-Machine and other mobile devices, certain advanced technologies related to high frequency trading, technologies relating to document stream operating systems and the identification of media content and enabling technology to support, among other things, the interoperability of smart home IoT devices. Network-1’s current strategy includes efforts to monetize four patent portfolios (the M2M/IoT, HFT, Cox and Smart Home portfolios). Network-1’s strategy is to focus on acquiring and investing in high quality patents which management believes have the potential to generate significant licensing opportunities as Network-1 achieved with respect to its Remote Power Patent and Mirror Worlds Patent Portfolio. Network-1’s Remote Power Patent generated licensing revenue in excess of $188,000,000 from May 2007 through December 31, 2025. Network-1 achieved licensing and other revenue of $47,150,000 through December 31, 2025 with respect to its Mirror Worlds Patent Portfolio.
This release contains forward-looking statements within the meaning of the “safe harbor” provisions of the Private Securities Litigation Reform Act of 1995. These statements address future events and conditions concerning Network-1’s business plans. Such statements are subject to a number of risk factors and uncertainties as disclosed in the Network-1’s Annual Report on Form 10-K for the year ended December 31, 2025 filed with the Securities and Exchange Commission on March 13, 2026, Network-1’s uncertain revenue from licensing its intellectual property, uncertainty as to the outcome of pending litigation involving Network-1’s HFT Patent Portfolio and its M2M/IoT Patent Portfolio, whether Network-1 will be successful in its appeal to the Federal Circuit of the District Court judgment of non-infringement dismissing Network-1’s litigation against Google and YouTube involving certain patents within its Cox Patent Portfolio, the ability of Network-1 to successfully execute its strategy to acquire or make investments in high quality patents with significant licensing opportunities, Network-1’s ability to achieve revenue and profits from its Cox Patent Portfolio, M2M/IoT Patent Portfolio, HFT Patent Portfolio and Smart Home Portfolio, as well as a successful outcome on its investment in ILiAD Biotechnologies, Inc. or other intellectual property it may acquire or finance in the future, the ability of Network-1 to enter into additional license agreements, uncertainty as to whether cash dividends will continue to be paid, Network-1’s ability to enter into strategic relationships with third parties to license or otherwise monetize their intellectual property, the risk in the future of Network-1 being classified as a Personal Holding Company which may result in Network-1 issuing a special cash dividend to its stockholders, future economic conditions and technology changes and legislative, regulatory and competitive developments. Except as otherwise required to be disclosed in periodic reports, Network-1 expressly disclaims any future obligation or undertaking to update or revise any forward-looking statement contained herein.
Network‑1’s Consolidated Statements of Operations and Consolidated Balance Sheet are attached.
Years Ended December 31,
2025
2024
REVENUE
$
150,000
$
100,000
OPERATING EXPENSES:
Costs of revenue
42,000
28,000
Professional fees and related costs
788,000
959,000
General and administrative
2,485,000
2,614,000
Amortization of patents
141,000
120,000
TOTAL OPERATING EXPENSES
3,456,000
3,721,000
OPERATING LOSS
(3,306,000
)
(3,621,000
)
OTHER INCOME
Interest and dividend income, net
1,844,000
1,897,000
Net realized and unrealized gain on marketable securities
277,000
177,000
Total other income, net
2,121,000
2,074,000
LOSS BEFORE INCOME TAXES AND SHARE OF
NET LOSSES OF EQUITY METHOD INVESTEE
(1,185,000
)
(1,547,000
)
INCOME TAXES PROVISION:
Current
(31,000
)
―
Deferred taxes, net
(337,000
)
(425,000
)
Total income taxes benefit
(368,000
)
(425,000
)
LOSS BEFORE SHARE OF NET LOSSES OF EQUITY METHOD INVESTEE:
(817,000
)
(1,122,000
)
SHARE OF NET LOSSES OF EQUITY METHOD INVESTEE
(1,603,000
)
(1,912,000
)
NET LOSS
$
(2,420,000
)
$
(3,034,000
)
Net Loss Per Share:
Basic
$
(0.11
)
$
(0.13
)
Diluted
$
(0.11
)
$
(0.13
)
Weighted average common shares outstanding:
Basic
22,848,402
23,250,224
Diluted
22,848,402
23,250,224
Cash dividends declared per share
$
0.10
$
0.10
December 31,
2025
2024
ASSETS:
CURRENT ASSETS:
Cash and cash equivalents
$
13,402,000
$
13,145,000
Marketable securities, at fair value
23,467,000
27,455,000
Other current assets
237,000
232,000
Total Current Assets
37,106,000
40,832,000
OTHER ASSETS:
Patents, net of accumulated amortization
1,479,000
1,205,000
Equity method investment
1,734,000
3,337,000
Operating leases right of use asset
–
27,000
Security deposits
13,000
13,000
Total Other Assets
3,226,000
4,582,000
TOTAL ASSETS
$
40,332,000
$
45,414,000
LIABILITIES AND STOCKHOLDERS’ EQUITY:
CURRENT LIABILITIES:
Accounts payable
$
253,000
$
203,000
Accrued payroll
289,000
292,000
Other accrued expenses
228,000
247,000
Operating lease obligations
–
24,000
Total Current Liabilities
770,000
766,000
LONG TERM LIABILITIES:
Deferred tax liability
–
337,000
TOTAL LIABILITIES
770,000
1,103,000
COMMITMENTS AND CONTINGENCIES (See Note I)
STOCKHOLDERS’ EQUITY
Preferred stock, $0.01 par value; authorized 10,000,000 shares;
none issued and outstanding at December 31, 2025 and December 31, 2024
–
–
Common stock, $0.01 par value; authorized 50,000,000 shares;
22,824,009 and 22,961,619 shares issued and outstanding at December 31, 2025 and December 31, 2024, respectively
228,000
229,000
Additional paid-in capital
63,426,000
65,455,000
Accumulated deficit
(24,092,000
(21,373,000
)
TOTAL STOCKHOLDERS’ EQUITY
39,562,000
44,311,000
TOTAL LIABILITIES AND STOCKHOLDERS’ EQUITY
$
40,332,000
$
45,414,000
Contacts: Network-1 Technologies, Inc. Corey M. Horowitz, Chairman and CEO (917) 692-0000