Researchers map the peptide behind semaglutide across 25 brain regions in each sex, finding striking differences in appetite and reward circuits.
GLP-1 analogs, used to treat obesity, are among the most impactful drug classes in decades, yet we have lacked a detailed, sex-specific map of where GLP-1 is expressed in the brain.”
— Dr. Mone Zaidi, Institute Director, Icahn School of Medicine at Mount Sinai
NEW YORK, NY, UNITED STATES, March 10, 2026 /EINPresswire.com/ — The drugs have names that sound like small planets: semaglutide, liraglutide, lixisenatide. Collectively they belong to a class of glucagon-like peptide 1 (GLP-1) analogs that has reshaped the treatment of obesity and diabetes so thoroughly that the word “blockbuster” barely covers it. And yet for all the billions of dollars spent, for all the prescriptions written, a fundamental question has lingered like a low hum beneath the clinical noise: where, precisely, does GLP-1 live inside the brain, and does it set up house differently in females and males?
A new peer-reviewed study published in Brain Medicine (Genomic Press) answers both questions with startling clarity. Researchers at the Icahn School of Medicine at Mount Sinai have constructed what is, to their knowledge, the first comprehensive sex-specific atlas of GLP-1 expression in the murine brain at single-transcript resolution, identifying the peptide across 25 distinct brain nuclei, subnuclei, and regions in each sex. The findings, led by Vitaly Ryu, Anisa Gumerova, Georgii Pevnev, Tony Yuen, and senior author Mone Zaidi, reveal that the geography of GLP-1 in the brain is not uniform between females and males. It is, in places, dramatically different.
That matters. It matters because obesity and diabetes are common in both women and men, yet certain pathological and clinical features of these conditions exhibit sex-specific differences. It matters because GLP-1 appears to have stronger effects on appetite suppression, glycemic regulation, and body weight loss in females compared with males. And it matters because the psychiatric applications of GLP-1 analogs, including emerging evidence for efficacy in addiction, depression, and other conditions, remain largely unexplored through the lens of sex.
A technology refined for the task underpins the entire atlas. The team employed RNAscope, a technique capable of detecting single mRNA transcripts, to map Glp1 expression across the entire mouse brain in three female and three male animals. The approach hybridizes approximately 20 pairs of transcript-specific double Z-probes to 5-micrometer-thick whole brain sections, achieving a sensitivity that older analytical methods simply could not reach. GLP-1 is produced in relatively small quantities in the brain and rapidly degraded, which has historically made its detection a challenge. Two independent observers, blinded to sex, manually counted transcripts in every tenth section using systematic counting, and inter-rater reliability was confirmed. Probe specificity was validated by positive staining in the small intestine, pancreas, and medullary nucleus of the solitary tract, with absent staining in the kidney as a negative control.
The result is a compendium unlike anything that existed before.
Within the major brain divisions, the hindbrain revealed differences that run deep. RNAscope detected Glp1 expression in the medulla, olfactory bulb, midbrain and pons, hippocampus, hypothalamus, thalamus, and the ependymal layer of the third ventricle. The medulla and olfactory bulb harbored the highest total counts of Glp1 in both sexes. But the pattern within the medulla was not symmetrical. In females, the three regions with the highest Glp1 densities in the hindbrain were, in descending order, the raphe obscurus nucleus (ROb), the ventral part of the nucleus of the solitary tract (SolV), and the medial part of the solitary tract (SolM). In males, the highest densities appeared in the central (SolCe), intermediate (SolIM), and medial subnuclei of the solitary tract. Overall, Glp1 densities and total numbers of Glp1-expressing neurons in the ROb, SolV, and ventrolateral part of the solitary tract (SolVL) of females tended to be higher in comparison with males. The numbers of Glp1-expressing neurons were significantly higher in the SolV of females compared with males (P = 0.034), with a similar trend in the SolVL (P = 0.069).
“What struck us was not just where we found GLP-1 expression, but the degree to which the pattern diverged between females and males in specific hindbrain subnuclei,” said Vitaly Ryu, co-first author and lead designer of the experiments. “Several medullary nuclei displayed expression in only one sex, which opens entirely new questions about how GLP-1 circuits operate differently in the female and male brain.”
Several medullary nuclei displayed what the authors call sex-biased expression. Glp1 transcripts were detected only in the ambiguus nucleus, tectospinal tract, ventral cochlear nucleus (posterior part), and cuneate nucleus of females, while the dorsomedial spinal trigeminal nucleus, intercalated nucleus of the medulla, paramedian reticular nucleus, SolCe, and spinal trigeminal nucleus (caudal part) showed expression only in males. Two nuclei with the highest Glp1 expression in a single sex were the ambiguus nucleus in females and the SolCe in males. The authors note that the apparent absence of Glp1 expression in one sex may reflect limited power for very low-frequency events, and these findings should be viewed as hypothesis-generating.
Perhaps the most unexpected finding emerged from the olfactory bulb. Glp1 density was significantly greater in the olfactory bulb of males compared with females (P = 0.024), driven by markedly higher Glp1 densities in the granular cell layer (GrO) of males (P = 0.031). GLP-1-releasing interneurons have previously been located in the olfactory bulb of rats and mice, where they are hypothesized to modulate mitral cell excitability in relation to a post-prandial anorexigenic action.
The observation acquires sharper edges when placed beside recent work showing that food odor induces cephalic phase insulin release in lean and diet-induced obese male mice. Yet females appear to have enhanced olfactory abilities due to the presence and modulatory effects of estrogen via its receptors in the olfactory bulb. The authors suggest a compensatory relationship: given that GLP-1 has strong effects on appetite suppression, glycemic regulation, and body weight loss in females, it seems plausible that lower Glp1 densities in the GrO of females over males are compensated by sufficient and necessary estrogen actions on appetite regulation. Whether the noted higher Glp1 expression in the GrO of males contributes to higher insulin levels compared with females remains to be demonstrated. However, because male but not female mice develop hyperinsulinemia on high-fat diet, the authors describe it as tempting to speculate that GrO-derived GLP-1 may underlie a sex-specific amplification of olfactory-driven insulin signaling in males.
The study places GLP-1 within a broader network of sexually dimorphic peptide systems regulating ingestive behavior, revealing a web of peptides rather than a solo act. Under unstressed conditions, females have lower levels of orexigenic neuropeptide Y and fewer NPY-expressing neurons in the hypothalamus than males, while females possess more anorexigenic pro-opiomelanocortin (POMC) neurons displaying higher neural activities. Estrogen receptor alpha expressed by POMC neurons suppresses food intake in female but not male mice, pointing to an additional potential interplay between estrogen-driven anorexigenic POMC and GLP-1 mechanisms. Leptin signaling to hypothalamic targets is also sexually dimorphic, and leptin via its receptors stimulates GLP-1 receptor-expressing neurons in the solitary tract, having an additive effect on food intake suppression. The orexigenic gastric hormone ghrelin counterbalances leptin and interacts with GLP-1 through a gating mechanism on vagal neurons. GLP-1 neuronal axon terminals in the ROb lie in close apposition to serotonergic neurons in the parapyramidal region, suggesting projection to brainstem areas implicated in autonomic appetite suppression.
The portrait that emerges is not of a single molecule acting alone. It is a coordinated conversation among multiple peptidergic systems, each inflected by sex.
Though not as plentiful as in the solitary tract or olfactory bulb, the atlas extends well beyond appetite into psychiatric implications and Alzheimer’s disease. Glp1 expression was detected in the midbrain and pons (interfascicular nucleus, ventral tegmental area, paranigral nucleus, and interpeduncular fossa), hippocampus (granular layer of the dentate gyrus), hypothalamus (posterior hypothalamic area and lateral hypothalamus), thalamus (dorsal lateral geniculate nucleus), and ependymal layer of the third ventricle. The ventral tegmental area, a brain region central to reward processing, showed Glp1 expression only in females. The lateral hypothalamus, implicated in motivated behavior, showed expression only in males.
“The implications extend well beyond metabolism,” said Zaidi. “With growing evidence that GLP-1 analogs may help prevent or treat cognitive decline, and given that we can detect Glp1 transcripts in Alzheimer’s-vulnerable regions in the mouse brain, this atlas should help guide future investigations into how GLP-1 acts on neuroinflammation, neuronal degeneration, and memory loss.”
The authors are transparent about the boundaries of the work. The relatively small sample size of three animals per sex limits statistical power, particularly for detecting low-abundance or regionally sparse Glp1-expressing cells. Females were not staged for estrous cycle phase, which may contribute to variability within the female group but is unlikely to alter the main qualitative patterns reported. RNAscope identifies Glp1 expression but does not directly assess peptide synthesis, release, or functional engagement; conclusions regarding circuit-level or behavioral effects remain inferential. The atlas is optimized for detecting moderate-to-high Glp1 expression patterns and has limited statistical power to definitively determine presence or absence in regions characterized by sparse transcript abundance.
This atlas was not built to close a door. It was built to open one. The comprehensive mapping of Glp1 at the single-transcript level in the murine brain lays a foundation for identifying and interrogating new functional GLP-1 circuits in coordination with other peptides that regulate food intake and other behaviors, as well as guiding the development of more precise and effective GLP-1-based therapies. The expression pattern of preproglucagon neurons in the brain is highly conserved between rodents and nonhuman primates, which lends translational weight to the findings.
Somewhere between the raphe obscurus nucleus of a female mouse and the granular cell layer of a male, between the peptide that tells the body to stop eating and the estrogen that modulates how loud that signal gets, lies a piece of the puzzle that clinicians prescribing semaglutide have been assembling by intuition. Now there is an atlas.
The Research Article in Brain Medicine titled “Atlas of GLP-1 expression in the mouse brain: Neuroanatomical basis for metabolic and psychiatric effects,” is freely available via Open Access on 10 March 2026 in Brain Medicine at the following link: https://doi.org/10.61373/bm026a.0006
The full reference for citation purposes is: Ryu V, Gumerova A, Pevnev G, Yuen T, Zaidi M. Atlas of GLP-1 expression in the mouse brain: Neuroanatomical basis for metabolic and psychiatric effects. Brain Medicine 2026. DOI: https://doi.org/10.61373/bm026a.0006. Epub 2026 Mar 10.
Brain Medicine (ISSN: 2997-2639, online and 2997-2647, print) is a peer-reviewed medical research journal published by Genomic Press, New York. Brain Medicine is a new home for the cross-disciplinary pathway from innovation in fundamental neuroscience to translational initiatives in brain medicine. The journal’s scope includes the underlying science, causes, outcomes, treatments, and societal impact of brain disorders, across all clinical disciplines and their interface.
EIN Presswire provides this news content “as is” without warranty of any kind. We do not accept any responsibility or liability
for the accuracy, content, images, videos, licenses, completeness, legality, or reliability of the information contained in this
article. If you have any complaints or copyright issues related to this article, kindly contact the author above.
A peer-reviewed, multi-clinic study published in the Journal of Assisted Reproduction and Genetics suggests an epigenetic sperm-quality profile can add missing information for infertile couples and clinicians, especially when they are considering IUI (Intrauterine Insemination), IVF (In Vitro Insemination), and/or ICSI (Intracytoplasmic Sperm Injection).
Path Fertility’s review of this capstone research, including the data gathered from preceding studies, confirms clinical data show that “up to 25% of men with a ‘normal’ Semen Analysis result have sperm that are incapable of producing a healthy pregnancy without intervention via advanced fertility techniques.”
SALT LAKE CITY, UT / ACCESS Newswire / March 10, 2026 / A newly published, peer-reviewed study adds real-world evidence that some couples are stuck in “fertility limbo” even after a Semen Analysis comes back “normal.”
According to Andy Olson, CEO and Co-Founder of Path FertilityTM, while it’s obvious that traditional Semen Analysis testing is a crucial first step for understanding sperm viability, for many infertile couples, Semen Analysis alone is not enough.
“This new study reinforces what so many couples experience firsthand: ‘normal’ Semen Analysis test results don’t always come with answers,” Olson said. “In fact, our review of the clinical data shows that up to 25% of men with a ‘normal’ Semen Analysis result have sperm that are incapable of producing a healthy pregnancy without intervention via advanced fertility techniques.
“When couples are stuck in such fertility limbo, they deserve better information sooner. Peer-reviewed, real-world evidence like that shown in this JARG report (and data gathered from prior studies), can help patients and clinicians have a more informed conversation about what to try next and what expectations are realistic.”
PHOTO CAPTION: Andy Olson, CEO and Co-Founder of Path Fertility. March 2026.
What the JARG Study Found
The JARG study analyzed outcomes from 537 couples treated at 10 U.S. fertility clinics and reported a clear pattern: when men had an Abnormal result on an epigenetic sperm test, no pregnancies were recorded from Intrauterine Insemination (IUI) in the outcomes captured in this real-world dataset. {NOTE: Epigenetics is a DNA-level method for scientists to study how cells turn genes on and off, including within sperm cells.}
By contrast, outcomes for in-vitro fertilization (IVF) using Intracytoplasmic Sperm Injection (ICSI) did not show a meaningful difference based on the epigenetic result.
A Quick Translation of the Treatments Mentioned in the Study
To understand why these findings matter, it can help to understand the difference between common fertility treatments. For example,
IUI (intrauterine insemination) is a procedure in which sperm is placed into the uterus around the time of ovulation. It is often tried early by couples attempting to overcome fertility challenges because it is less invasive and less costly than IVF;
IVF (in vitro fertilization) is a process where eggs are retrieved and fertilized in a lab; and
ICSI (intracytoplasmic sperm injection) is a common IVF technique where a highly trained IVF lab embryologist injects a single sperm into an egg to help fertilization occur.
What Semen Analysis Can Show and What it Cannot
Within the medical community, a Semen Analysis test is considered the “Standard of Care” in the field of infertility when it comes to identifying how many sperm are present in a semen sample, how they look, and how they move.
But a Semen Analysis test does not answer the question most infertile couples care about the most: Can these sperm do the job needed to create a pregnancy, especially with a treatment like IUI?
In reality, some sperm can look “normal” with a Semen Analysis test, but still struggle with the key functions required for conception: finding the egg, binding to the egg, penetrating the egg, and fertilizing the egg.
What the Newer Test Looks at, in Plain English
The new JARG study focuses on a still new sperm test based on epigenetics that measures chemical markers that help control how genes behave and how well sperm are likely to function.
SpermQT™, the new sperm-DNA test offered by Path Fertility, is designed to complement Semen Analysis testing by providing this additional epigenetics information about sperm quality and function.
PHOTO CAPTION: The at-home version of SpermQT, a newsperm-DNA test offered by Path Fertility. March 2026
Why this New JARG Study Matters Now
What makes this JARG paper important is that it reports real-world outcomes across 10 clinics, based on anonymous patient data.
Specifically, the JARG study showed that for IUI outcomes, “Abnormal” epigenetic sperm results resulted in zero recorded IUI pregnancies among the couples in the JARG dataset. Conversely, in IVF cases that used ICSI, outcomes did not differ significantly based on the epigenetics result.
For mainstream readers, the takeaway is straightforward: a “normal” Semen Analysis test result is not always the end of the male-fertility conversation.
VIDEO CAPTION: SpermQT introductory video posted on YouTube (https://www.youtube.com/watch?v=EHvFUEBctTs). SpermQT is a new sperm-DNA test offered by Path Fertility.
In fact, additional sperm-focused information may help couples and clinicians set better expectations earlier, especially when deciding whether to keep trying IUI or to move more quickly to more advanced fertility techniques like IVF and/or ICSI.
How Prior Scientific Studies Led to this “Capstone” Result with JARG
This JARG report builds on two peer-reviewed research studies published in 2023, starting with a July 2023 study in Frontiers in Genetics. This data validated the broader scientific approach behind the testing available with SpermQT.
It also found that sperm epigenetic variability was linked with pregnancy and live birth outcomes for IUI, while IVF outcomes did not show a similar separation.
Additionally, a November 2023 study in F&S Science reported that adding epigenetic sperm information could improve how well an analysis of sperm predicted IUI outcomes. This same study reported that IVF outcomes, largely using ICSI, did not show the same differences across epigenetic sperm quality groups.
Together, the 2023 findings laid the scientific groundwork for a greater understanding of sperm viability for infertile couples, while the new JARG paper extended that work into a larger, multi-clinic, real-world setting.
A Perspective from the Clinic
“Many couples hear that the Semen Analysis results are ‘normal’ and assume the male side has been cleared,” said Kaylen Silverberg, MD, Medical Director and fertility specialist with Texas Fertility Center. “However, the type of peer-reviewed research in this JARG study supports a more comprehensive evaluation of male fertility, just as we do with our female patients. SpermQT test results enable couples to make decisions with clearer expectations, especially when considering whether to pursue repeated IUI cycles or proceed to IVF with ICSI.”
A Comment from Path’s Scientific Leadership
“Clinicians and couples alike should think of the data provided by SpermQT results as another piece of the puzzle,” said Kristin Brogaard, Ph.D., Co-Founder and Chief Science Officer of Path Fertility, and a co-author of the JARG study. “Clearly, traditional Semen Analysis testing is still the ‘Standard of Care’ in fertility circles. However, this new test provides a deeper level of detail about sperm function that standard testing does not measure directly, and this additional information can be invaluable to couples struggling with infertility.”
PHOTO CAPTION: Kristin Brogaard, Ph.D., Chief Science Officer and Co-Founder pf Path Fertility. March 2026.
Responsible Interpretation
This new study in JARG reports real-world associations across clinics and treatments, but it does not tell any individual couple what they should do. Patients should discuss testing and treatment options with a qualified clinician who can consider the full medical picture of both partners.
PHOTO CAPTION: SpermQT Test Results Overview Page from Path Fertility. March 2026
About Path Fertility and SpermQT
Path Fertility is focused on raising the “Standard of Care” in male fertility by providing deeper insight into sperm quality and function. As such, SpermQT is a sperm quality test based on epigenetic DNA-markers and is designed to complement Semen Analysis by adding new information related to sperm function.
NOTE: Published Studies Referenced in this Release
SALT LAKE CITY, UT / ACCESS Newswire / March 10, 2026 / Path FertilityTM, an epigenetics-driven fertility technology company, today unveiled the Path Fertility Facts Sheet, a copy of which is embedded below within this news release.
BEGINNING OF THE Path FertilityTM Facts Sheet
Overview
Path FertilityTM helps clinicians and patients uncover male-factor insights that can be missed by “Standard-of-Care” Semen Analysis testing alone, so couples can make more informed fertility treatment decisions sooner.
Path Fertility offers clinically validated testing that evaluates sperm quality and function using epigenetics, providing additional insight into reproductive potential and likely success with common fertility treatment pathways.
Such insights are now validated through three separate, peer-reviewed studies published, respectively, by
The Journal of Assisted Reproduction and Genetics (JARG), 2026;
F&S Science, 2023; and
Frontiers in Genetics, 2023.
Details noted below.
Why this Matters
In fertility care, the male partner is too often “cleared” based on a Semen Analysis result that falls into a reference range. But “Normal” test results do not always mean normal sperm function.
Path Fertility exists to help close that information gap earlier, helping couples reduce avoidable time, cost, and emotional strain.
Flagship Test: SpermQT™
SpermQT™ is a clinically validated epigenetic sperm quality test designed to help predict the likelihood of pregnancy success with certain fertility treatment pathways, especially Intrauterine Insemination (IUI), a procedure where sperm are placed directly into the uterus during ovulation.
VIDEO CAPTION: The “SpermQT vs. Standard Semen Analysis: What’s the Difference?” video from Path Fertility. Video available on YouTube here (https://www.youtube.com/watch?v=nQDm7hngzBk).
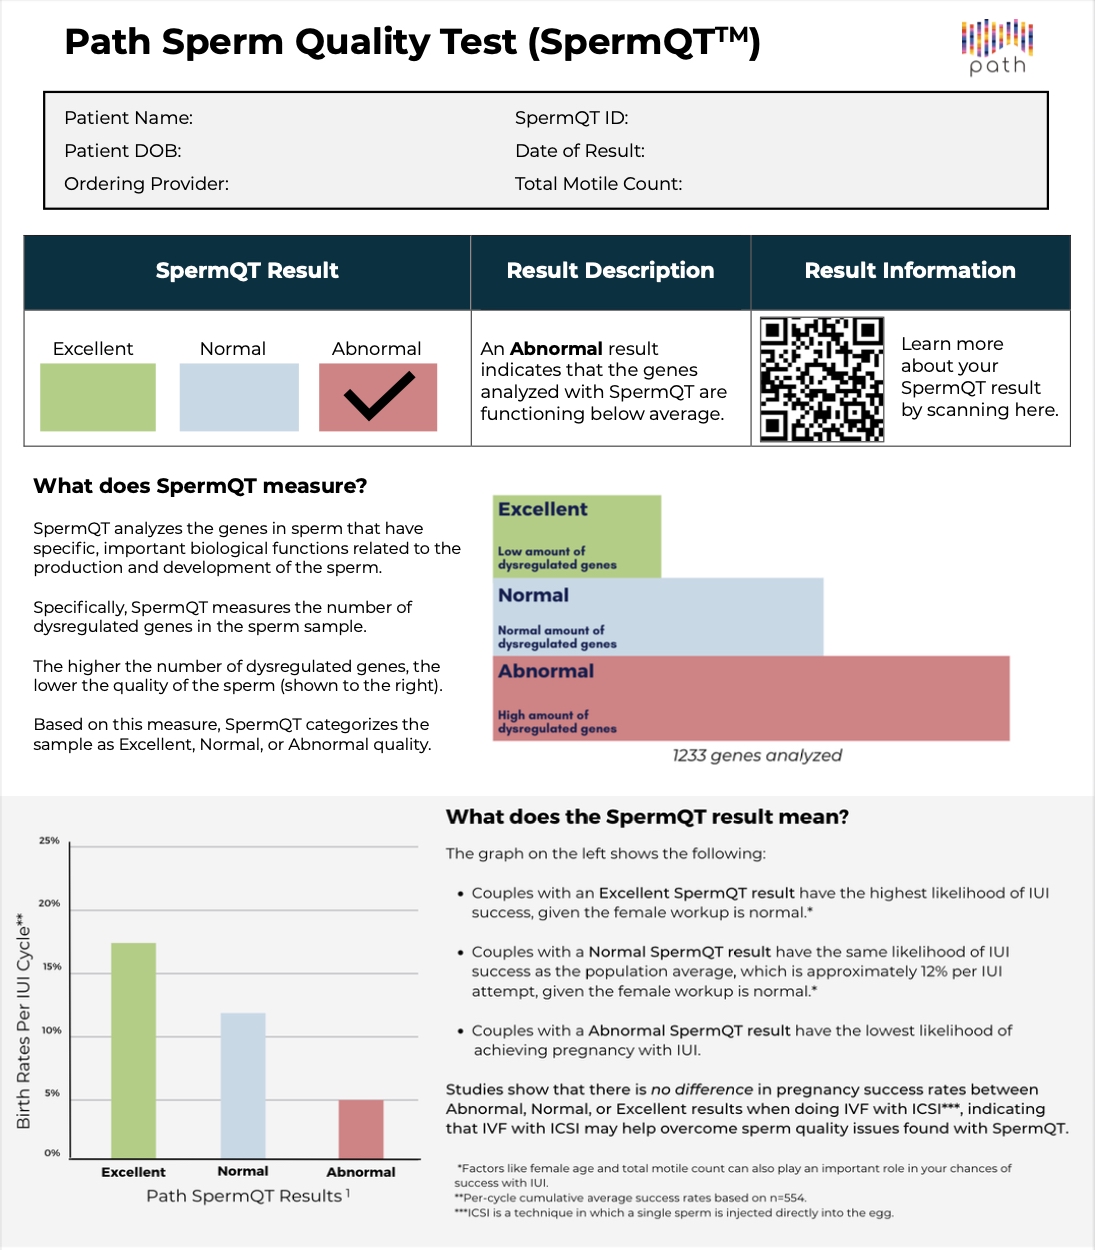
What SpermQT Measures
DNA methylation patterns associated with sperm quality and function, i.e., the presence of certain DNA abnormalities in sperm
Functional capability associated with sperm’s ability to find, bind, penetrate, and fertilize
DNA methylation dysregulation across 1,200+ genes
Results are reported as
Excellent,
Normal, and
Abnormal.
Key Clinical Insights
Review of the clinical data shows that SpermQT results are associated with meaningful differences in pregnancy outcomes for couples pursuing IUI.
SpermQT can identify subfertile men who may be missed by Semen Analysis alone; case in point, 4 out of 5 men with an Abnormal SpermQT result receive a “Normal” test result via Semen Analysis testing.
Either In Vitro Fertilization (IVF), where eggs are fertilized in a lab, or with Intracytoplasmic Sperm Injection (ICSI), where a single sperm is injected into an egg, may help overcome certain sperm quality challenges observed in epigenetic testing.
PHOTO CAPTION: SpermQT overview page from Path Fertility. March 2026
Who can Benefit
Patients / Couples
Couples exploring treatment options and wanting better clarity before choosing a path,
Couples with “unexplained infertility,” including cases with “Normal” Semen Analysis results, and
Couples with failed IUI cycles that need better decision support on next steps.
Providers
Fertility clinics and reproductive endocrinology teams seeking better early male-factor insights,
Urology and andrology practices aiming to improve male workup resolution, and
Clinics seeking stronger prediction support for IUI planning and counseling.
When to use SpermQT
SpermQT is designed as a complement to, and not a replacement of, “Standard-of-Care” Semen Analysis. It is often most useful:
Early in the initial male fertility workup, alongside Semen Analysis,
When Semen Analysis is “Normal” but pregnancy has not occurred as expected, and
After failed IUI attempts to inform whether to continue IUI or move to IVF, with or without ICSI.
How it Works
Physician-ordered test (ordering support available through Path Fertility),
Sample collected via at-home kit (or clinic workflow when applicable),
Testing performed; results returned in about 2 weeks, and
Provider reviews results with the patient to inform next-step planning.
END OF THE Path Fertility Fact Sheet AND COMPLETION OF THE NEWS RELEASE BELOW
About Path Fertility and SpermQT
Path Fertility is focused on raising the “Standard of Care” in male fertility by providing deeper insight into sperm quality and function. As such, SpermQT is a sperm quality test based on epigenetic DNA-markers and is designed to complement Semen Analysis by adding new information related to sperm function.
Path Fertility, SpermQT, and the Path Fertility logos are trademarks of Inherent Biosciences, Inc. All other trademarks are property of their respective owners.
God’s personal name appears 6,823 times in Scripture. A new book explores what it means — and why it still matters today.
In an age of religious confusion, the greatest need is simple: to know the true God by the name He gave Himself — Yahweh.”
— Hegumen Abraam Sleman
EAST BRUNSWICK, NJ, UNITED STATES, March 9, 2026 /EINPresswire.com/ — A newly released theological work, Yahweh: The Hebrew Name of God, invites readers into a deeper understanding of the divine name revealed in the Hebrew Scriptures and its profound significance for faith today.
The sacred name Yahweh — represented by the four Hebrew letters יהוה (YHWH), the Tetragrammaton — is the personal name by which God revealed Himself to Moses at the burning bush, declaring, “This is My name forever” (Exodus 3:15). It appears no fewer than 6,823 times in the ancient Hebrew manuscripts of the Bible, yet it remains one of the most overlooked and least understood realities in modern religious life. This book sets out to restore what has been forgotten.
About the Book:
Drawing from biblical texts, historical scholarship, and theological reflection, Yahweh: The Hebrew Name of God traces the full story of the divine name — its linguistic roots in the Tetragrammaton, its theological depth, its covenantal significance, and its living connection to the name of Yahshua (Jesus), whose very name means “Yahweh saves.”
Organized into ten chapters, the book moves through the complete biblical witness of the divine name: the meaning and mystery of the Tetragrammaton; the profound unity between the name of the Father, Yahweh, and the name of the Son, Yahshua; the history of the divine name across Bible translations and languages; the significance and distinctiveness of the name in Scripture; Yahweh in covenantal context from Abraham to the New Covenant; Yahweh in worship and liturgy — the Shema, the Psalms, the festivals of Israel; Yahweh as revealed in His character through names such as Yahweh Sabaoth, Yahweh Shalom, and Yahweh Rapha; the majesty and holiness of the name; the seriousness of misusing it; and practical, prophetic ways to proclaim the name of Yahweh today.
The governing conviction of the book is clear: to know the true God is the greatest need of humanity, and the Scriptures consistently identify Him by name. The knowledge of Yahweh is not abstract theology — it is the foundation of every covenant, every act of salvation, and every word of prophecy in the Bible. In an era of religious confusion and competing ideas about God, Yahweh: The Hebrew Name of God offers something rare: a return to the ground of Scripture itself, and to the God who said, “I AM WHO I AM.”
Who This Book Is For:
This book speaks to pastors, theologians, and students of Scripture, as well as to any believer who has sensed that something essential has been lost in the way we speak about God — and who longs to recover it. It will also speak to Jewish readers who know the name but have been taught not to speak it, and to seekers from any background who are asking whether the God of the Bible can truly be known.
About the Author
Hegumen Abraam D. Sleman is a Coptic Orthodox priest and theologian whose ministry spans decades of pastoral service, biblical teaching, and theological writing. His work focuses on the revelation of God in Scripture, the Hebrew foundations of the Christian faith, and the proclamation of the Gospel in its full biblical depth. He has authored numerous works exploring the name of God, the identity of Christ, and the unity of the biblical message from Genesis to Revelation.
EIN Presswire provides this news content “as is” without warranty of any kind. We do not accept any responsibility or liability
for the accuracy, content, images, videos, licenses, completeness, legality, or reliability of the information contained in this
article. If you have any complaints or copyright issues related to this article, kindly contact the author above.
This gritty crime novel follows one man’s confessional journey through addiction, betrayal, love, and violence as he confronts the wreckage of his choices.
NEW YORK CITY, NY, UNITED STATES, March 9, 2026 /EINPresswire.com/ — Author Christopher DeMauro presents a gripping and emotionally intense narrative in Ride or Die, a crime-driven novel that explores the turbulent life of a career criminal caught in a cycle of addiction, loyalty, and devastating consequences. Through the voice of its troubled narrator, the story unfolds as a confession filled with chaos, regret, and a desperate search for meaning.
The novel follows Donovan Jones, a hardened criminal whose life spirals through a world defined by crime, toxic relationships, and constant danger. From the beginning, Donovan’s story is shaped by his volatile partnership with Bonnie, a fierce and fearless companion who shares both his criminal ambitions and his reckless lifestyle. Their bond is intense, passionate, and ultimately tragic.
When Bonnie’s death shatters Donovan’s world, grief quickly turns into rage and self-destruction. Struggling to cope with the loss, he plunges deeper into a violent criminal underworld where survival often depends on loyalty, intimidation, and quick decisions made in moments of desperation.
As Donovan’s life continues to unravel, he becomes involved with Jasmine, a woman carrying emotional wounds of her own. Together, they attempt to outrun the past through robberies, street violence, and a desperate effort to build a new future. Yet the deeper they fall into crime, the more impossible it becomes to escape the consequences that follow them.
The story reaches darker territory when Donovan’s twisted sense of loyalty leads to the betrayal and murder of Orlando, a man who trusted him like a brother. This act becomes a turning point that accelerates Donovan’s descent into paranoia, guilt, and relentless fear of capture.
Through police pursuits, violent confrontations, and the constant pressure of a collapsing life, Donovan’s story moves toward an inevitable reckoning. The novel’s powerful confessional tone reaches its climax when Donovan, wounded and facing the end of his journey, reflects from a hospital bed on the choices that led him there.
Ride or Die invites readers to consider a haunting question: Is Donovan Jones an irredeemable criminal, or is he a broken product of the world that shaped him?
EIN Presswire provides this news content “as is” without warranty of any kind. We do not accept any responsibility or liability
for the accuracy, content, images, videos, licenses, completeness, legality, or reliability of the information contained in this
article. If you have any complaints or copyright issues related to this article, kindly contact the author above.
The debut in the Montana and Sam West series delivers high stakes suspense where glamour, ambition, and deadly secrets collide from a storyteller rooted in film
NEW YORK CITY, NY, UNITED STATES, March 9, 2026 /EINPresswire.com/ — Drawing on decades of experience inside the entertainment industry, veteran television executive Kenneth Nowling pulls back the velvet curtain on Hollywood’s glittering facade in Tinseltown Murders, a suspense-driven noir thriller that launches the Montana and Sam West crime franchise. Crafted with cinematic precision and layered intrigue, the novel blends sharp dialogue, insider detail, and franchise-ready storytelling in a series designed with adaptation in mind.
Nowling, whose career in television has shaped his understanding of pacing, character arcs, and long-form narrative structure, delivers a story where fame is fleeting, secrets are currency, and survival depends on knowing when to step out of the spotlight. With Tinseltown Murders, he introduces a world built not only for readers, but for the screen.
“After three decades in television production, I’ve approached my novels the same way studios approach long-term storytelling — building a crime IP library designed to support multiple adaptations across film and television.”
At the center of the novel is Montana West, a former silver-screen icon who once commanded Hollywood with talent, poise, and undeniable presence. After walking away from stardom and the compromises it demanded, Montana builds a quieter life alongside her husband, Detective Sam West. But when a promising young actress is found murdered on set under suspicious circumstances, Montana is drawn back into the world she thought she had left behind.
The tragedy is swiftly managed with public relations spin, whispered rumors, and corporate deflection. The studio seeks silence. The press demands scandal. Law enforcement wants answers. Montana, however, wants the truth. Partnering with Sam, she reenters a landscape of fragile egos, ruthless executives, desperate fame seekers, and careers constructed on carefully managed deception.
Nowling’s portrayal of Hollywood balances seduction with menace. The glamorous backdrop contrasts sharply with the corruption and betrayal simmering beneath the surface. Through Montana’s dual perspective as both insider and outsider, readers experience the tension of navigating an industry where every interaction feels rehearsed and every smile may hide a threat.
While Tinseltown Murders launches the Montana and Sam West series, it also builds upon Nowling’s expanding body of work, which includes Havana Nights and The Conspiracy. Together, his novels reflect a consistent focus on intrigue, power dynamics, and the unseen forces that shape public narratives — themes that resonate across both page and screen.
Tinseltown Murders appeals to readers who appreciate high-stakes mysteries set against sophisticated settings. Fans of modern noir and character-driven suspense will find themselves immersed in a narrative that examines second chances, ambition, and the dangerous price of fame. Montana West emerges as a compelling heroine, equally comfortable commanding a stage or confronting shadows, determined to prove that truth matters even in a city built on performance.
EIN Presswire provides this news content “as is” without warranty of any kind. We do not accept any responsibility or liability
for the accuracy, content, images, videos, licenses, completeness, legality, or reliability of the information contained in this
article. If you have any complaints or copyright issues related to this article, kindly contact the author above.
Dr. Raza Bokhari, Executive Chairman & CEO will participate in panel discussions and highlight Company’s AI-enabled Drug Development Strategy
PHILADELPHIA, PA / ACCESS Newswire / March 10, 2026 / Medicus Pharma Ltd. (NASDAQ:MDCX) (“Medicus” or the “Company”), a biotech/life sciences company focused on advancing the clinical development programs of novel and potentially disruptive therapeutics assets, is pleased to announce its participation in the Longwood Miami CEO forum being held March 11-13, 2026, at the Ritz-Carlton Key Biscayne.
Dr. Raza Bokhari, Executive Chairman & CEO of Medicus, will serve on a panel titled “Accelerating the Path to Patient Care” and will highlight company’s AI enabled Drug development strategy designed to make clinical trials not only cost efficient but also time efficient.
Other panelists include Lindsay Edwards, CTO & President of Platform, Relation Therapeutics; Julie Gerberding, CEO, Foundation for the NIH and Former Director, CDC; and Gilmore O’Neill, CEO, Editas Medicine. The panel will be moderated by Jon Cohen, Head of Life Sciences Go-To-Market at ServiceNow.
Longwood Miami CEO is an invitation-only event, that brings together Industry leaders, innovators, thought leaders and opinion makers, who will speak on curated fireside chats, roundtables, and discussion panels.
Notable Participants in the conference include Brent Saunders (CEO, Bausch + Lomb), Chris Boshoff (CSO & President, R&D, Pfizer), Rob Califf (former Commissioner, FDA), Sidney Taurel (Chair Emeritus, Lilly), Bill Mezzanotte (Head, R&D, CSL), David Redfern (President, Corporate Development, GSK), Pablo Cagnoni (Head, R&D, Incyte), Julie Gerberding (former Director, CDC), Bill Hait (Chief Scientific Advisor, AACR; former CMO, J&J), Jeremy Levin (Chair & CEO, Ovid Therapeutics), David Meek (former CEO, Ipsen; CEO, Genetix), Frank Nestle (CEO, Deerfield Discovery), Benj Garrett (Managing Director, Stifel), among others.
Medicus Pharma Ltd. (Nasdaq:MDCX) is a precision-guided biotech/life sciences company focused on accelerating the clinical development programs of novel and potentially disruptive therapeutics assets. The Company is actively engaged in multiple countries across three continents.
SkinJect Inc., a wholly owned subsidiary of Medicus Pharma Ltd., is a development-stage life sciences company focused on commercializing a novel, non-invasive treatment for basal cell skin cancer using a patented dissolvable microneedle patch to deliver a chemotherapeutic agent to eradicate tumor cells.
In August 2025, the Company announced its entry into a non-binding memorandum of understanding (MoU) with Helix Nanotechnologies, Inc. (HelixNano), a Boston-based biotech company focused on developing a proprietary advanced mRNA platform, in respect of their shared mutual interest in the development or commercial arrangement contemplated by the MoU. The MoU is non-binding and shall not be construed to obligate either party to proceed with a joint venture or any further development or commercial arrangement, unless and until definitive agreements are executed.
In August 2025, the Company completed the acquisition of Antev, a UK-based late clinical stage biotech company, developing Teverelix, a next-generation gonadotrophin-releasing hormone (GnRH) antagonist, as a first-in-market product for cardiovascular high-risk advanced prostate cancer patients and patients with first acute urinary retention relapse (AURr) episodes due to enlarged prostate.
Unlike GnRH agonists, which can cause an initial surge in testosterone levels, Teverelix directly suppresses sex hormone production without this surge, potentially reducing cardiovascular risks. This mechanism is particularly beneficial for patients with existing cardiovascular conditions. Teverelix is formulated as a microcrystalline suspension, allowing for sustained release and a six-week dosing interval, which may improve patient compliance and outcomes.
In October 2025, the Company announced a strategic collaboration with the Gorlin Syndrome Alliance (GSA) to advance compassionate access to SkinJect for patients suffering from Gorlin Syndrome, also known as nevoid basal cell carcinoma syndrome.
Under the collaboration, Medicus and the GSA will jointly pursue the Expanded Access IND Program with the FDA to allow patients with multiple, recurrent, or inoperable basal cell carcinomas (BCCs) to access SkinJect under physician-supervised treatment protocols. The initiative aims to establish a framework for expanded access while collecting valuable real-world safety and tolerability data to inform future regulatory filings. It will also more tightly integrate patient community-led insights and data into the design, monitoring, and long-term development of SkinJect in this rare disease population.
In November 2025, the Company received full regulatory and ethical approvals in the United Kingdom to expand its ongoing Phase 2 clinical study (SKNJCT-003) evaluating D-MNA to non-invasively treat BCC of the skin. The approvals were issued by the Medicines and Healthcare products Regulatory Agency (MHRA), the Health Research Authority (HRA) and the Wales Research Ethics Committee (WREC). The MHRA approval followed a comprehensive scientific review of the Investigational Medicinal Product Dossier (IMPD) and protocol. The WREC issued a favorable ethical opinion, and the HRA granted study-wide governance approval, confirming compliance with UK Good Clinical Practice and National Health Service capacity and capability standards.
In December 2025, the Company announced that it has successfully completed enrolment of 90 patients in the United States for Phase 2 clinical study (SKNJCT-003) evaluating D-MNA to non-invasively treat BCC of the skin. The Company expects to secure an end-of-Phase 2 meeting with the FDA in the first half of 2026.
In December 2025, Medicus announced a non-binding letter of intent with Reliant AI Inc., a decision-intelligence company specializing in generative AI for the life sciences industry, to collaborate on the development of an AI-driven clinical data analytics platform. Subject to execution of definitive agreements, the platform is expected to support capital-efficient clinical development through data-driven dynamic clinical-site selection, patient stratification and enrollment forecasting. The initial phase of the collaboration is expected to support an upcoming Teverelix clinical study planned for 2026, with potential expansion into later-stage development programs in collaboration with a strategic partner.
In February 2026, the Company announced that it has received “study may proceed” clearance from the U.S. Food and Drug Administration (FDA) to initiate its Phase 2b dose-optimization study of Teverelix®, an investigational next generation long-acting GnRH antagonist, in men with advanced prostate cancer (APC).
Cautionary Notice on Forward-Looking Statements
Certain information in this news release constitutes “forward-looking information” under applicable securities laws. “Forward-looking information” is defined as disclosure regarding possible events, conditions or financial performance that is based on assumptions about future economic conditions and courses of action and includes, without limitation, statements regarding the Company’s leadership and prospects, the collaboration with GSA including the potential benefits thereof for GSA, those suffering with Gorlin Syndrome and Medicus (including as it relates to the development of SkinJect™), ability to be approved for the Expanded Access IND Program to enable those suffering with Gorlin Syndrome to access SkinJect™ under physician-supervised treatment protocols, the development of Teverelix and expectations concerning, and future outcomes relating to, the development, advancement and commercialization of Teverelix for AURr, high CV risk prostate cancer, women’s health indications like endometriosis, and the potential market opportunities related thereto, the MOU, including the potential signing of definitive agreements between Medicus and HelixNano and the development of thermostable infectious diseases vaccines by combining HelixNano’s proprietary mRNA vaccine platform with Medicus’s proprietary microneedle array (MNA) delivery platform, the Company’s aim to fast-track the clinical development program and convert the SKNJCT-003 exploratory clinical trial into a pivotal clinical trial, and approval from the FDA and the timing thereof, including with respect to the Company’s submission for approval in the FDA Commissioner’s National Priority Voucher program, plans and expectations concerning, and future outcomes relating to, the development, advancement and commercialization of SkinJect through SKNJCT-003 and SKNJCT-004, and the potential market opportunities related thereto, the Company’s expectations regarding reported efficacy findings and whether there will be material changes to its reported SKNJCT-003 topline results and to secure an EOP2 meeting with the FDA in the first half of 2026, entry into definitive documents with Reliant and the expected terms thereof, engaging in proposed Medicus-sponsored studies currently contemplated in the Reliant non-binding letter of intent and the expected benefits thereof, the expansion of SKNJCT-003 into the United Kingdom and the potential benefits therefrom, the advancement of the SKNJCT-004 study and the potential results of and benefits of such study. Forward-looking statements are often but not always, identified by the use of such terms as “may”, “on track”, “aim”, “might”, “will”, “will likely result”, “could,” “designed,” “would”, “should”, “estimate”, “plan”, “project”, “forecast”, “intend”, “expect”, “anticipate”, “believe”, “seek”, “continue”, “target”, “potential” or the negative and/or inverse of such terms or other similar expressions. These statements involve known and unknown risks, uncertainties and other factors, which may cause actual results, performance or achievements to differ materially from those expressed or implied by such statements, including those risk factors described in the Company’s annual report on form 10-K for the year ended December 31, 2024 (the “Annual Report”), and in the Company’s other public filings on EDGAR and SEDAR+, which may impact, among other things, the trading price and liquidity of the Company’s common shares. Forward-looking statements contained in this news release are expressly qualified by this cautionary statement and reflect our expectations as of the date hereof and thus are subject to change thereafter. The Company disclaims any intention or obligation to update or revise any forward-looking statements, whether as a result of new information, future events or otherwise, except as required by law. Readers are further cautioned not to place undue reliance on forward-looking statements as there can be no assurance that the plans, intentions or expectations upon which they are placed will occur. Such information, although considered reasonable by management at the time of preparation, may prove to be incorrect and actual results may differ materially from those anticipated.
FY25 EPS of $0.08; FY25 Adjusted EPS growth of 5% to $0.83
YoY Increase in Cash Flow from Operations of $148 million; Free Cash Flow more than doubled to $187 million
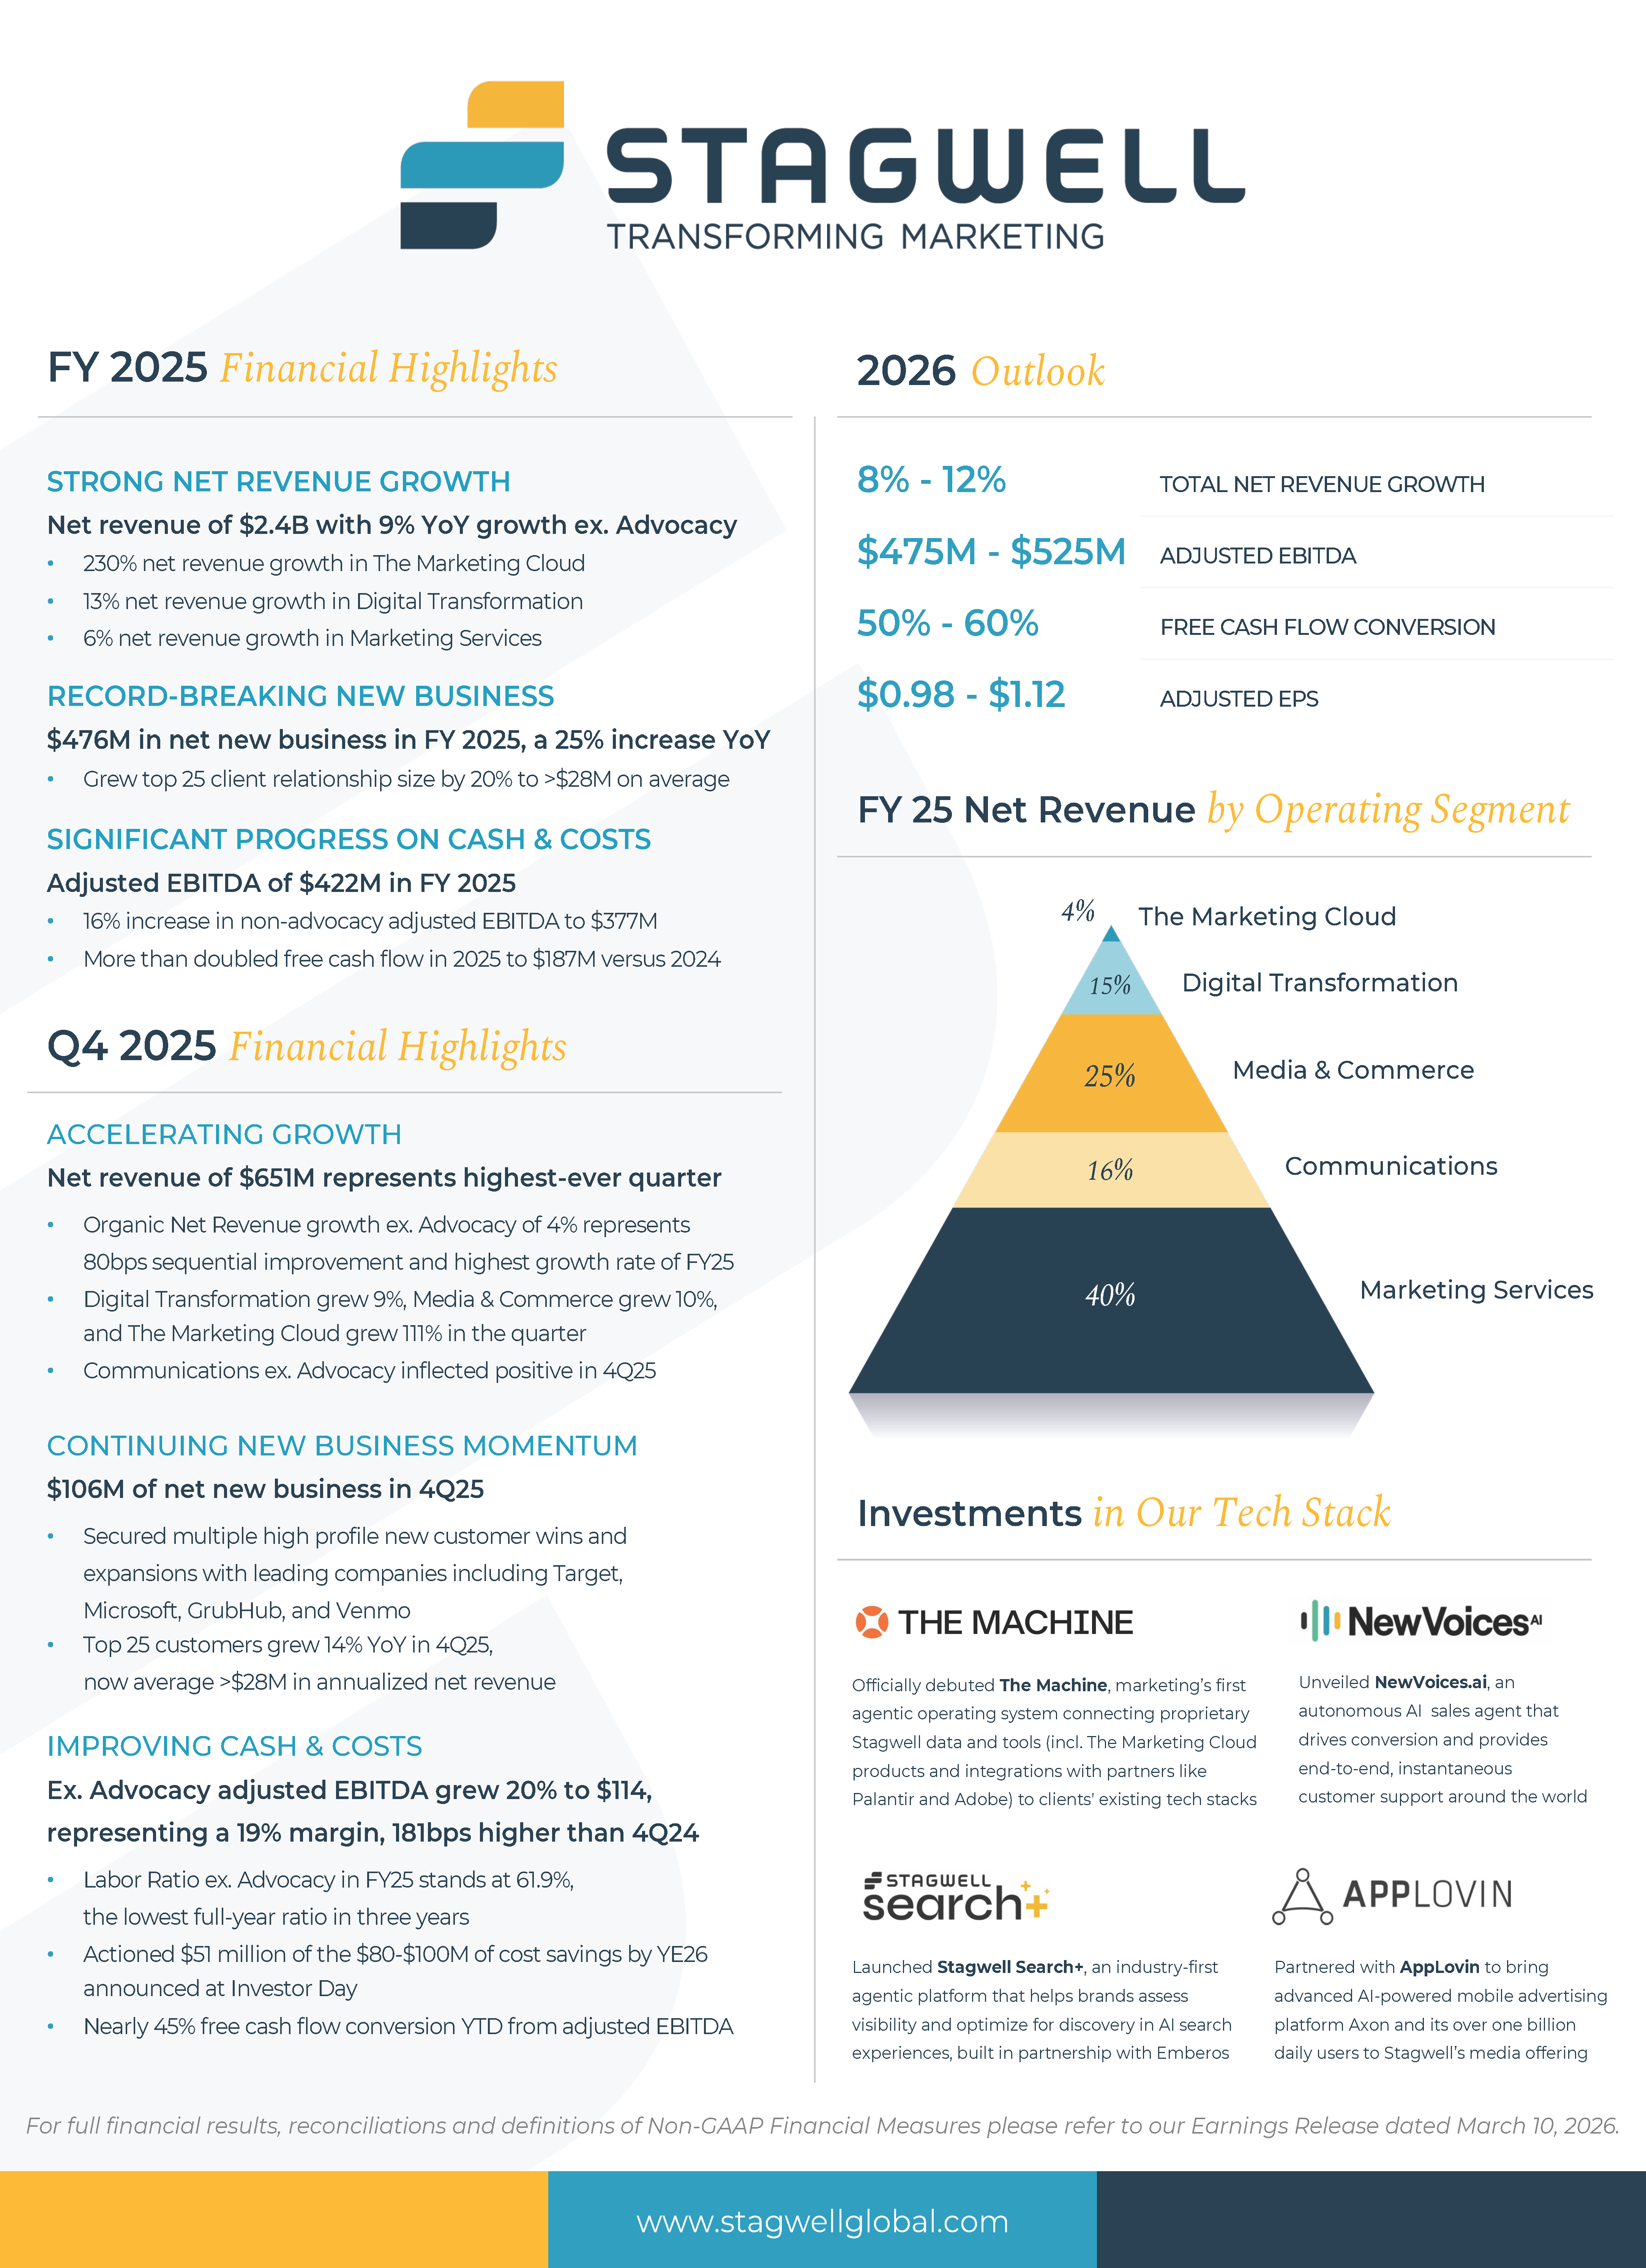
FY25 YoY Revenue Growth of 2%; FY25 YoY Net Revenue Growth of 6%
FY25 YoY Net Revenue Growth excluding Advocacy of 9%, Digital Transformation Net Revenue Growth of 13%, Marketing Services Net Revenue Growth of 6%
The Marketing Cloud delivered YoY Net Revenue Growth of 230%
FY25 Net Income Attributable to Stagwell Inc. Common Shareholders of $29 million; FY25 Adjusted EBITDA of $422 million; FY25 Adjusted EBITDA ex. Advocacy YoY Growth of 16% to $377 million
Net New Business of $106 million in Q4; LTM Net New Business of $476 million
Company Announces $350 Million Increase in Stock Repurchase Program; $400 Million Now Available Under the Program
Guidance for 2026 of Total Net Revenue Growth of 8% to 12%; Adjusted EBITDA of $475 million to $525 million; Free Cash Flow Conversion of 50% to 60%
NEW YORK CITY, NY / ACCESS Newswire / March 10, 2026 / (NASDAQ:STGW) – Stagwell Inc. (“Stagwell”) today announced financial results for the year ended December 31, 2025.
FOURTH QUARTER AND FULL YEAR RESULTS:
Q4 Revenue of $807 million, an increase of 2% versus the prior year period; FY25 Revenue of $2,909 million, an increase of 2% versus the prior year period;
Q4 Revenue ex. Advocacy of $742 million, an increase of 12% versus the prior year period; FY25 Revenue ex. Advocacy of $2,689 million, an increase of 9% versus the prior year period;
Q4 Net Revenue of $651 million, an increase of 3% versus the prior year period; FY25 Net Revenue of $2,428 million, an increase of 6% versus the prior year period;
Q4 Net Revenue ex. Advocacy of $609 million, an increase of 8% versus the prior year period; FY25 Net Revenue ex. Advocacy of $2,282 million, an increase of 9% versus the prior year period;
Q4 Net Income attributable to Stagwell Inc. Common Shareholders of $13 million versus $3 million in the prior year period; FY25 Net Income attributable to Stagwell Inc. Common Shareholders of $29 million versus $2 million in the prior year period;
Q4 Adjusted EBITDA of $129 million, an increase of 3% versus the prior year period; FY25 Adjusted EBITDA of $422 million, an increase of 1% versus the prior year period;
Q4 Adjusted EBITDA Margin of 20% on net revenue; FY25 Adjusted EBITDA Margin of 17% on net revenue;
Q4 Earnings Per Share Attributable to Stagwell Inc. Common Shareholders of $0.05 versus $0.03 in the prior year period; FY25 Earnings Per Share Attributable to Stagwell Inc. Common Shareholders of $0.08 versus $0.02 in the prior year period;
Q4 Adjusted Earnings Per Share attributable to Stagwell Inc. Common Shareholders of $0.30 versus $0.25 in the prior year period; FY25 Adjusted Earnings Per Share attributable to Stagwell Inc. Common Shareholders of $0.83 versus $0.79 in the prior year period;
YTD Net Cash provided by Operating Activities of $291 million versus $143 million in the prior year period;
Net new business of $106 million in the fourth quarter, last twelve-month net new business of $476 million
See “Non-GAAP Financial Measures” below for explanations and reconciliations of the Company’s non-GAAP financial measures.
“In 2025, Stagwell increased its strategic pivot toward AI applications and services, building a powerful foundation for 2026. With accelerating growth ex-advocacy, record net new business, expanding margins and doubled free cash flow, our FY25 results prove our strategy is working,” shared Mark Penn, Stagwell’s Chairman and CEO. “We see great opportunity in 2026 to capitalize on an industry distracted by restructurings and mergers, and bolster our position as a winner in the age of AI.”
Ryan Greene, Chief Financial Officer, commented: “2025 marked an inflection year for Stagwell, with clear momentum in the underlying business and improving efficiency contributing to strong year-over-year net revenue, adjusted EBITDA and adjusted EPS growth. Proactive cash management meant we more than doubled our free cash flow in 2025. We expect another strong year in 2026, and will be aggressive in our capital allocation to drive shareholder value.”
Financial Outlook
2026 financial guidance is as follows:
Total Net Revenue growth of 8% to 12%
Adjusted EBITDA of $475 million to $525 million
Free Cash Flow Conversion of 50% to 60%
Adjusted EPS of $0.98 – $1.12
Guidance includes anticipated impact from acquisitions or dispositions.
* The Company has excluded a quantitative reconciliation with respect to the Company’s 2026 guidance under the “unreasonable efforts” exception in Item 10(e)(1)(i)(B) of Regulation S-K. See “Non-GAAP Financial Measures” below for additional information.
Stock Repurchase Program
On March 4, 2026, the Board of Directors authorized an extension and a $350.0 million increase in the size of our previously approved stock repurchase program (the “Repurchase Program”). Under the Repurchase Program, as amended, we may repurchase up to an aggregate of $725.0 million of shares of our outstanding Class A common stock, par value $0.001 per share (“Class A Common Stock”), with any previous purchases under the Repurchase Program continuing to count against that limit. With the increase, we have a total of approximately $400.0 million available for repurchases. The Repurchase Program will expire on March 4, 2029.
Video Webcast
Management will host a video webcast on Tuesday, March 10, 2026, at 8:30 a.m. (ET) to discuss results for Stagwell Inc. for the year ended December 31, 2025. The video webcast will be accessible at https://edge.media-server.com/mmc/p/3x58p928/. An investor presentation has been posted on our website at www.stagwellglobal.com and may be referred to during the webcast.
A recording of the webcast will be accessible one hour after the webcast and available for ninety days at www.stagwellglobal.com.
Stagwell Inc.
Stagwell is the challenger network built to transform marketing. We deliver scaled creative performance for the world’s most ambitious brands, connecting culture-moving creativity with leading-edge technology to harmonize the art and science of marketing. Led by entrepreneurs, our specialists in 45+ countries are unified under a single purpose: to drive effectiveness and improve business results for their clients. Join us at www.stagwellglobal.com.
In addition to its reported results, Stagwell Inc. has included in this earnings release certain financial results that the Securities and Exchange Commission (SEC) defines as “non-GAAP Financial Measures.” Management believes that such non-GAAP financial measures, when read in conjunction with the Company’s reported results, can provide useful supplemental information for investors analyzing period to period comparisons of the Company’s results. Such non-GAAP financial measures include the following:
(1) Organic Net Revenue: “Organic net revenue growth” and “Organic net revenue decline” reflects the year-over-year change in the Company’s reported net revenue attributable to the Company’s management of the entities it owns. We calculate organic net revenue growth (decline) by subtracting the net impact of acquisitions (divestitures) and the impact of foreign currency exchange fluctuations from the aggregate year-over-year increase or decrease in the Company’s reported net revenue. The net impact of acquisitions (divestitures) reflects the year-over-year change in the Company’s reported net revenue attributable to the impact of all individual entities that were acquired or divested in the current and prior year. We calculate impact of an acquisition as follows: (a) for an entity acquired during the current year, we present the entity’s current period reported revenue as the impact of the acquisition in the current year; and (b) for an entity acquired in the prior year, we present an amount equal to the entity’s current year net revenue for the same period during which we didn’t own the entity in the prior year as the impact of the acquisition in the current year. We calculate impact of a divestiture as follows: (a) for a divestiture in the current year, we present the entity’s prior year net revenue for the same period during which we no longer owned it in the current year as impact of the divestiture in the current year; and (b) for a divestiture in the prior year, we present the entity’s prior year net revenue for the period during which we owned it in the prior year as impact of the divestiture in the current year. We calculate the impact of any acquisition or divestiture without adjusting for foreign currency exchange fluctuations. The impact of foreign currency exchange fluctuations reflects the year-over-year change in the Company’s reported net revenue attributable to changes in foreign currency exchange rates. We calculate the impact of foreign currency exchange fluctuations for the portion of the reporting period in which we recognized revenue from a foreign entity in both the current year and the prior year. The impact is calculated as the difference between (1) reported prior period net revenue (converted to U.S. dollars at historical foreign currency exchange rates) and (2) prior period net revenue converted to U.S. dollars at current period foreign exchange rates.
(2) Net New Business: Estimate of annualized revenue for new wins less annualized revenue for losses incurred in the period.
(3) Adjusted EBITDA: defined as Net income (loss) attributable to Stagwell Inc. common shareholders excluding non-operating income or expense to achieve operating income (loss), plus depreciation and amortization, stock-based compensation, deferred acquisition consideration adjustments, impairment and other losses, and other items. Other items primarily includes restructuring, certain system implementation, working capital administrative fees and acquisition-related expenses. Adjusted EBITDA for our reportable segments is reconciled to Operating Income (Loss), as Net Income (Loss) is not a relevant reportable segment financial metric.
(4) Adjusted Diluted EPS” is defined as (i) Net income (loss) attributable to Stagwell Inc. common shareholders, plus net income (loss) attributable to Class C shareholders, excluding the impact of amortization expense, impairment and other losses, stock-based compensation, deferred acquisition consideration adjustments, discrete tax items, and other items (as defined above), based on total consolidated amounts, then allocated to Stagwell Inc. common shareholders and Class C shareholders, based on their respective income allocation percentage using a normalized effective income tax rate divided by (ii) the diluted weighted average shares outstanding. The diluted weighted average shares outstanding is calculated as (a) the diluted weighted average number of common shares outstanding plus (b) the shares of Class C Common Stock as if converted to shares of Class A Common Stock if not included because they were anti-dilutive.
(5) Free Cash Flow: defined as Net cash provided from operations less normalized capital expenditures and capitalized software. Free Cash Flow Conversion is the percentage of adjusted EBITDA.
Included in this earnings release are tables reconciling reported Stagwell Inc. results to arrive at certain of these non-GAAP financial measures.
This document contains forward-looking statements within the meaning of Section 27A of the Securities Act of 1933, as amended (the “Securities Act”), and Section 21E of the Securities Exchange Act of 1934, as amended (the “Exchange Act”). The Company’s representatives may also make forward-looking statements orally or in writing from time to time. Statements in this document that are not historical facts, including, statements about the Company’s beliefs and expectations, future financial performance, growth, and future prospects, the Company’s strategy, business and economic trends and growth, technological leadership and differentiation, potential and completed acquisitions, anticipated and actual operating efficiencies and synergies and estimates of amounts for redeemable noncontrolling interests and deferred acquisition consideration, constitute forward-looking statements. Forward-looking statements, which are generally denoted by words such as “ability,” “aim,” “anticipate,” “assume,” “believe,” “better,” “build,” “consider,” “continue,” “could,” “develop,” “drive,” “enhance,” “estimate,” “expect,” “focus,” “forecast,” “future,” “grow,” “guidance,” “improve,” “intend,” “likely,” “maintain,” “may,” “ongoing,”, “outlook,” “plan,” “position,” “possible,” “potential,” “probable,” “project,” “seek,” “should,” “target,” “will,” “would” or the negative of such terms or other variations thereof and terms of similar substance used in connection with any discussion of current plans, estimates and projections are subject to change based on a number of factors, including those outlined in this section.
Forward-looking statements in this document are based on certain key expectations and assumptions made by the Company. Although the management of the Company believes that the expectations and assumptions on which such forward-looking statements are based are reasonable, undue reliance should not be placed on the forward-looking statements because the Company can give no assurance that they will prove to be correct. The material assumptions upon which such forward-looking statements are based include, among others, assumptions with respect to general business, economic and market conditions, the competitive environment, anticipated and unanticipated tax consequences and anticipated and unanticipated costs. These forward-looking statements are based on current plans, estimates and projections, and are subject to change based on a number of factors, including those outlined in this section. These forward-looking statements are subject to various risks and uncertainties, many of which are outside the Company’s control. Therefore, you should not place undue reliance on such statements. Forward-looking statements speak only as of the date they are made, and the Company undertakes no obligation to update publicly any of them in light of new information or future events, if any.
Forward-looking statements involve inherent risks and uncertainties. A number of important factors could cause actual results to differ materially from those contained in any forward-looking statements. Such risk factors include, but are not limited to, the following:
risks associated with international, national and regional unfavorable economic conditions, including the effect of changing tariff and other trade policies, inflation and other macroeconomic factors that could affect the Company or its clients;
demand for the Company’s services, which may precipitate or exacerbate other risks and uncertainties;
inflation and actions taken by central banks to counter inflation;
the Company’s ability to attract new clients and retain existing clients;
the impact of a reduction in client spending and changes in client advertising, marketing and corporate communications requirements;
financial failure of the Company’s clients;
the Company’s ability to retain and attract key employees;
the Company’s ability to compete in the markets in which it operates;
the Company’s ability to achieve its cost saving initiatives;
the Company’s implementation of strategic initiatives;
the Company’s ability to remain in compliance with its debt agreements and the Company’s ability to finance its contingent payment obligations when due and payable, including but not limited to those relating to redeemable noncontrolling interests, deferred acquisition consideration and profit interests;
the Company’s ability to manage its growth effectively;
the Company’s ability to identify and complete acquisitions or other strategic transactions that complement and expand the Company’s business capabilities and successfully integrate newly acquired businesses into the Company’s operations, retain key employees, and realize cost savings, synergies and other related anticipated benefits within the expected time period;
the Company’s ability to identify and complete divestitures and to achieve the anticipated benefits therefrom;
the Company’s ability to develop products incorporating new technologies, including augmented reality, artificial intelligence, and virtual reality, and realize benefits from such products;
the Company’s use of artificial intelligence, including generative artificial intelligence;
adverse tax consequences for the Company, its operations and its stockholders, that may differ from the expectations of the Company, including that recent or future changes in tax laws, potential changes to corporate tax rates in the United States and disagreements with tax authorities on the Company’s determinations that may result in increased tax costs;
adverse tax consequences in connection with the business combination that formed the Company in August 2021, including the incurrence of material Canadian federal income tax (including material “emigration tax”);
the Company’s ability to maintain an effective system of internal control over financial reporting, including the risk that the Company’s internal controls will fail to detect misstatements in its financial statements;
the Company’s ability to accurately forecast its future financial performance and provide accurate guidance;
the Company’s ability to protect client data from security incidents or cyberattacks;
economic disruptions resulting from war and other economic and geopolitical tensions (such as the ongoing military conflicts in Iran and the Middle East, and between Russia and Ukraine), terrorist activities, natural disasters, public health events, and tariff and trade policies;
stock price volatility; and
foreign currency fluctuations.
Investors should carefully consider these risks factors, the additional risk factors outlined under the caption “Risk Factors” in this Form 10-K, and in the Company’s other filings with the Securities and Exchange Commission (the”SEC”) which are accessible on the SEC’s website at www.sec.gov.
SCHEDULE 1 STAGWELL INC. UNAUDITED CONSOLIDATED STATEMENTS OF OPERATIONS (amounts in thousands, except per share amounts)
Three Months Ended December 31,
Year Ended December 31,
2025
2024
2025
2024
Revenue
$
807,444
$
788,708
$
2,909,000
$
2,841,216
Operating Expenses
Cost of services
503,718
502,522
1,845,958
1,842,978
Office and general expenses
203,481
203,887
732,326
711,803
Depreciation and amortization
43,614
38,771
171,249
151,652
Impairment and other losses
–
–
466
1,715
750,813
745,180
2,749,999
2,708,148
Operating Income
56,631
43,528
159,001
133,068
Other income (expenses):
Interest expense, net
(24,431
)
(24,038
)
(96,438
)
(92,317
)
Foreign exchange, net
(1,156
)
645
(1,640
)
(1,656
)
Gain (loss) on sale of business
(2,245
)
–
(2,245
)
–
Bargain purchase gain
9,937
–
9,937
–
Other, net
2,314
(547
)
171
(1,372
)
(15,581
)
(23,940
)
(90,215
)
(95,345
)
Income before income taxes and equity in earnings of non-consolidated affiliates
41,050
19,588
68,786
37,723
Income tax expense
24,321
3,741
38,271
13,182
Income before equity in earnings of non-consolidated affiliates
16,729
15,847
30,515
24,541
Equity in income of non-consolidated affiliates
93
–
111
503
Net income
16,822
15,847
30,626
25,044
Net income attributable to noncontrolling and redeemable noncontrolling interests
(4,162
)
(12,612
)
(1,525
)
(22,785
)
Net income attributable to Stagwell Inc. common shareholders
$
12,660
$
3,235
$
29,101
$
2,259
Earnings Per Common Share:
Basic
$
0.05
$
0.03
$
0.13
$
0.02
Diluted
$
0.05
$
0.03
$
0.08
$
0.02
Weighted Average Number of Common Shares Outstanding:
Basic
251,650
109,266
220,608
110,890
Diluted
258,997
115,147
264,523
115,752
SCHEDULE 2 STAGWELL INC. UNAUDITED COMPONENTS OF NET REVENUE CHANGE (amounts in thousands)
Net Revenue – Components of Change
Change
Three Months Ended December 31, 2024
Foreign Currency
Net Acquisitions (Divestitures)
Organic (1)
Total Change
Three Months Ended December 31, 2025
Organic
Total
Marketing Services
$
240,262
$
2,017
$
1,315
$
1,215
$
4,547
$
244,809
0.5
%
1.9
%
Digital Transformation
84,570
(130
)
5,419
2,335
7,624
92,194
2.8
%
9.0
%
Media & Commerce
161,720
1,745
3,154
11,546
16,445
178,165
7.1
%
10.2
%
Communications
131,736
385
–
(23,796
)
(23,411
)
108,325
(18.1
)%
(17.8
)%
The Marketing Cloud
13,122
485
8,706
5,404
14,595
27,717
41.2
%
111.2
%
Corporate, eliminations and other
(1,787
)
–
–
1,410
1,410
(377
)
(78.9
)%
(78.9
)%
$
629,623
$
4,502
$
18,594
$
(1,886
)
$
21,210
$
650,833
(0.3
)%
3.4
%
(1) See Non-GAAP Financial Measures section above for the definition of Organic Net Revenue.
SCHEDULE 3 STAGWELL INC. UNAUDITED COMPONENTS OF NET REVENUE CHANGE (amounts in thousands)
Net Revenue – Components of Change
Change
Year Ended December 31, 2024
Foreign Currency
Net Acquisitions (Divestitures)
Organic (1)
Total Change
Year Ended December 31, 2025
Organic
Total
Marketing Services
$
905,117
$
3,491
$
9,788
$
41,280
$
54,559
$
959,676
4.6
%
6.0
%
Digital Transformation
324,183
(405
)
13,615
29,779
42,989
367,172
9.2
%
13.3
%
Media & Commerce
601,503
3,396
5,829
(708
)
8,517
610,020
(0.1
)%
1.4
%
Communications
435,626
547
29,002
(71,744
)
(42,195
)
393,431
(16.5
)%
(9.7
)%
The Marketing Cloud
32,265
941
62,229
11,051
74,221
106,486
34.3
%
230.0
%
Corporate, eliminations and other
(2,032
)
–
–
(7,082
)
(7,082
)
(9,114
)
NM
NM
$
2,296,662
$
7,970
$
120,463
$
2,576
$
131,009
$
2,427,671
0.1
%
5.7
%
(1) See Non-GAAP Financial Measures section above for the definition of Organic Net Revenue.
SCHEDULE 4 STAGWELL INC. UNAUDITED SEGMENT OPERATING RESULTS (amounts in thousands)
For the Three Months Ended December 31, 2025
Marketing Services
Digital Transformation
Media & Commerce
Communications
The Marketing Cloud
Corporate, Elimination and Other
Total
Net revenue
$
244,809
$
92,194
$
178,165
$
108,325
$
27,717
$
(377
)
$
650,833
Billable costs
50,555
9,117
32,862
64,037
35
5
156,611
Revenue
295,364
101,311
211,027
172,362
27,752
(372
)
807,444
Billable costs
50,555
9,117
32,862
64,037
35
5
156,611
Staff costs
144,258
63,081
93,713
57,083
14,964
17,055
390,154
Administrative costs
20,304
7,668
25,988
13,799
4,243
12,238
84,240
Unbillable and other costs, net
18,103
154
21,000
2,390
5,511
(1
)
47,157
Adjusted EBITDA(1)
62,144
21,291
37,464
35,053
2,999
(29,669
)
129,282
Stock-based compensation
4,647
1,041
1,127
(435
)
87
3,486
9,953
Depreciation and amortization
12,154
5,924
8,637
6,362
6,078
4,459
43,614
Deferred acquisition consideration
–
4,542
68
(2,143
)
(23
)
–
2,444
Impairment and other losses
–
–
–
–
–
–
–
Other items, net(1)
5,996
366
7,437
1,362
1,042
437
16,640
Operating income (loss)
$
39,347
$
9,418
$
20,195
$
29,907
$
(4,185
)
$
(38,051
)
$
56,631
(1) See Non-GAAP Financial Measures section above for the definition of Adjusted EBITDA and Other items, net.
SCHEDULE 5 STAGWELL INC. UNAUDITED SEGMENT OPERATING RESULTS (amounts in thousands)
For the Year Ended December 31, 2025
Marketing Services
Digital Transformation
Media & Commerce
Communications
The Marketing Cloud
Corporate, Elimination and Other
Total
Net revenue
$
959,676
$
367,172
$
610,020
$
393,431
$
106,486
$
(9,114
)
$
2,427,671
Billable costs
175,145
26,327
80,655
199,146
51
5
481,329
Revenue
1,134,821
393,499
690,675
592,577
106,537
(9,109
)
2,909,000
Billable costs
175,145
26,327
80,655
199,146
51
5
481,329
Staff costs
565,484
247,967
363,031
229,356
68,647
52,411
1,526,896
Administrative costs
105,801
27,267
93,003
50,841
17,613
7,938
302,463
Unbillable and other costs, net
78,333
1,305
64,833
9,300
22,689
(1
)
176,459
Adjusted EBITDA(1)
210,058
90,633
89,153
103,934
(2,463
)
(69,462
)
421,853
Stock-based compensation
19,716
4,122
4,191
6,325
628
19,113
54,095
Depreciation and amortization
52,295
23,174
30,263
25,711
23,514
16,292
171,249
Deferred acquisition consideration
(4,784
)
12,271
3,010
(7,022
)
(10,942
)
–
(7,467
)
Impairment and other losses
–
–
–
222
244
–
466
Other items, net(1)
10,228
1,859
17,549
5,048
3,651
6,174
44,509
Operating income (loss)
$
132,603
$
49,207
$
34,140
$
73,650
$
(19,558
)
$
(111,041
)
$
159,001
(1) See Non-GAAP Financial Measures section above for the definition of Adjusted EBITDA and Other items, net.
SCHEDULE 6 STAGWELL INC. UNAUDITED SEGMENT OPERATING RESULTS (amounts in thousands)
For the Three Months Ended December 31, 2024
Marketing Services
Digital Transformation
Media & Commerce
Communications
The Marketing Cloud
Corporate, Elimination and Other
Total
Net revenue
$
240,262
$
84,570
$
161,720
$
131,736
$
13,122
$
(1,787
)
$
629,623
Billable costs
48,294
2,110
11,719
97,372
–
(410
)
159,085
Revenue
288,556
86,680
173,439
229,108
13,122
(2,197
)
788,708
Billable costs
48,294
2,110
11,719
97,372
–
(410
)
159,085
Staff costs
146,876
60,557
91,108
69,381
10,614
11,685
390,221
Administrative costs
25,300
6,102
22,190
13,646
2,725
3,312
73,275
Unbillable and other costs, net
15,458
605
18,944
2,882
2,860
–
40,749
Adjusted EBITDA(1)
52,628
17,306
29,478
45,827
(3,077
)
(16,784
)
125,378
Stock-based compensation
2,093
(1,480
)
1,866
2,254
157
8,345
13,235
Depreciation and amortization
12,680
5,585
7,301
6,556
3,193
3,456
38,771
Deferred acquisition consideration
3,379
4,221
(1,292
)
9,673
(936
)
–
15,045
Other items, net(1)
8,823
201
1,863
1,403
88
2,421
14,799
Operating income (loss)
$
25,653
$
8,779
$
19,740
$
25,941
$
(5,579
)
$
(31,006
)
$
43,528
(1) See Non-GAAP Financial Measures section above for the definition of Adjusted EBITDA and Other items.
SCHEDULE 7 STAGWELL INC. UNAUDITED SEGMENT OPERATING RESULTS (amounts in thousands)
For the Year Ended December 31, 2024
Marketing Services
Digital Transformation
Media & Commerce
Communications
The Marketing Cloud
Corporate, Elimination and Other
Total
Net revenue
$
905,117
$
324,183
$
601,503
$
435,626
$
32,265
$
(2,032
)
$
2,296,662
Billable costs
172,490
11,473
93,899
267,439
–
(747
)
544,554
Revenue
1,077,607
335,656
695,402
703,065
32,265
(2,779
)
2,841,216
Billable costs
172,490
11,473
93,899
267,439
–
(747
)
544,554
Staff costs
557,776
227,522
356,684
232,096
28,686
46,942
1,449,706
Administrative costs
101,145
21,809
83,572
47,335
9,777
11,408
275,046
Unbillable and other costs, net
70,924
1,393
65,188
10,840
6,117
–
154,462
Adjusted EBITDA(1)
175,272
73,459
96,059
145,355
(12,315
)
(60,382
)
417,448
Stock-based compensation
17,095
6,622
6,265
7,721
805
13,653
52,161
Depreciation and amortization
53,106
22,398
31,450
20,100
12,502
12,096
151,652
Deferred acquisition consideration
5,379
7,911
(7,745
)
18,770
(1,320
)
–
22,995
Impairment and other losses
1,500
–
–
–
–
215
1,715
Other items, net(1)
20,251
3,090
17,103
4,860
629
9,924
55,857
Operating income (loss)
$
77,941
$
33,438
$
48,986
$
93,904
$
(24,931
)
$
(96,270
)
$
133,068
(1) See Non-GAAP Financial Measures section above for the definition of Adjusted EBITDA and Other items, net.
SCHEDULE 8 STAGWELL INC. UNAUDITED RECONCILIATION OF ADJUSTED DILUTED EARNINGS PER SHARE (NON-GAAP MEASURE) (amounts in thousands, except per share amounts)
For the Three Months Ended December 31, 2025
GAAP
Adjustments
Non-GAAP
Net income attributable to Stagwell Inc. common shareholders and adjusted net income
$
12,660
$
64,037
$
76,697
Diluted – Weighted average number of shares outstanding
258,997
–
258,997
Diluted EPS and Adjusted Diluted EPS (1)
$
0.05
$
0.30
Adjustments to Net income
Amortization
$
38,333
Stock-based compensation
9,953
Deferred acquisition consideration
2,444
Other items, net
16,639
67,369
Adjusted tax expense
(3,332
)
$
64,037
(1) See Non-GAAP Financial Measures section above for the definition of Adjusted Diluted EPS.
SCHEDULE 9 STAGWELL INC. UNAUDITED RECONCILIATION OF ADJUSTED DILUTED EARNINGS PER SHARE (NON-GAAP MEASURE) (amounts in thousands, except per share amounts)
For the Year Ended December 31, 2025
GAAP
Adjustments
Non-GAAP
Net income attributable to Stagwell Inc. common shareholders
$
29,101
$
198,129
$
227,230
Net loss attributable to Class C shareholders
(6,637
)
–
(6,637
)
Net income attributable to Stagwell Inc. and Class C shareholders and adjusted net income
$
22,464
$
198,129
$
220,593
Diluted – Weighted average number of common shares outstanding
225,468
–
225,468
Weighted average number of shares of Class C Common Stock outstanding
39,055
–
39,055
Diluted – Weighted average number of shares outstanding
264,523
–
264,523
Diluted EPS and Adjusted Diluted EPS (1)
$
0.08
$
0.83
Adjustments to Net Income
Amortization
$
145,506
Impairment and other losses
466
Stock-based compensation
54,095
Deferred acquisition consideration
(7,467
)
Other items, net
46,792
239,392
Adjusted tax expense
(41,263
)
$
198,129
(1) See Non-GAAP Financial Measures section above for the definition of Adjusted Diluted EPS.
SCHEDULE 10 STAGWELL INC. UNAUDITED RECONCILIATION OF ADJUSTED DILUTED EARNINGS PER SHARE (NON-GAAP MEASURE) (amounts in thousands, except per share amounts)
For the Three Months Ended December 31, 2024
GAAP
Adjustments
Non-GAAP
Net income attributable to Stagwell Inc. common shareholders
$
3,235
$
22,778
$
26,013
Net income attributable to Class C shareholders
–
41,549
41,549
Net income attributable to Stagwell Inc. and Class C and adjusted net income
$
3,235
$
64,327
$
67,562
Diluted – Weighted average number of common shares outstanding
115,147
–
115,147
Weighted average number of shares of Class C Common Stock outstanding
–
151,649
151,649
Diluted – Weighted average number of shares outstanding
115,147
151,649
266,796
Diluted EPS and Adjusted Diluted EPS (1)
$
0.03
$
0.25
Adjustments to Net income
Amortization
$
30,572
Stock-based compensation
13,235
Deferred acquisition consideration
15,045
Other items, net
14,799
73,651
Adjusted tax expense
(20,618
)
53,033
Net income attributable to Class C shareholders
11,294
$
64,327
Allocation of adjustments to Net income
Net income attributable to Stagwell Inc. common shareholders
$
22,778
Net income attributable to Class C shareholders – add-backs
30,255
Net income attributable to Class C shareholders
11,294
41,549
$
64,327
(1) See Non-GAAP Financial Measures section above for the definition of Adjusted Diluted EPS.
SCHEDULE 11 STAGWELL INC. UNAUDITED RECONCILIATION OF ADJUSTED DILUTED EARNINGS PER SHARE (NON-GAAP MEASURE) (amounts in thousands, except per share amounts)
For the Year Ended December 31, 2024
GAAP
Adjustments
Non-GAAP
Net income attributable to Stagwell Inc. common shareholders
$
2,259
$
82,506
$
84,765
Net income attributable to Class C shareholders
–
126,735
126,735
Net income attributable to Stagwell Inc. and Class C shareholders and adjusted net income
$
2,259
$
209,241
$
211,500
Diluted – Weighted average number of common shares outstanding
115,752
–
115,752
Weighted average number of shares of Class C Common Stock outstanding
–
151,649
151,649
Diluted – Weighted average number of shares outstanding
115,752
151,649
267,401
Diluted EPS and Adjusted Diluted EPS (1)
$
0.02
$
0.79
Adjustments to Net income
Amortization
$
122,442
Impairment and other losses
1,715
Stock-based compensation
52,161
Deferred acquisition consideration
22,995
Other items, net
55,857
255,170
Adjusted tax expense
(63,073
)
192,097
Net income attributable to Class C shareholders
17,144
$
209,241
Allocation of adjustments to Net income
Net income attributable to Stagwell Inc. common shareholders
$
82,506
Net income attributable to Class C shareholders – add-backs
109,591
Net income attributable to Class C shareholders
17,144
126,735
$
209,241
(1) See Non-GAAP Financial Measures section above for the definition of Adjusted Diluted EPS.
SCHEDULE 12 STAGWELL INC. UNAUDITED CONSOLIDATED BALANCE SHEETS (amounts in thousands)
December 31, 2025
December 31, 2024
ASSETS
Current Assets
Cash and cash equivalents
$
104,537
$
131,339
Accounts receivable, net
735,752
716,415
Expenditures billable to clients
164,694
173,194
Other current assets
157,309
114,200
Total Current Assets
1,162,292
1,135,148
Fixed assets, net
73,081
72,706
Right-of-use assets – operating leases
213,576
219,400
Goodwill
1,595,238
1,554,146
Other intangible assets, net
834,248
836,783
Deferred tax assets
281,057
46,926
Other assets
55,055
43,112
Total Assets
$
4,214,547
$
3,908,221
LIABILITIES, REDEEMABLE NONCONTROLLING INTERESTS (“RNCI”), AND SHAREHOLDERS’ EQUITY
Current Liabilities
Accounts payable
$
548,320
$
449,347
Accrued media
239,490
245,883
Accruals and other liabilities
291,554
265,356
Advance billings
329,815
294,609
Current portion of lease liabilities – operating leases
55,386
60,195
Current portion of deferred acquisition consideration
15,446
51,906
Total Current Liabilities
1,480,011
1,367,296
Long-term debt
1,326,013
1,353,624
Long-term portion of deferred acquisition consideration
24,598
50,209
Long-term lease liabilities – operating leases
224,397
245,397
Deferred tax liabilities
54,726
47,239
Long-term tax receivable agreement liability
252,390
25,493
Other liabilities
51,077
33,646
Total Liabilities
3,413,212
3,122,904
Redeemable Noncontrolling Interests
24,968
8,412
Commitments, Contingencies and Guarantees
Shareholders’ Equity
Common shares – Class A
252
115
Common shares – Class C
–
2
Paid-in capital
744,463
343,647
Retained earnings
32,930
11,740
Accumulated other comprehensive loss
(19,252
)
(23,773
)
Stagwell Inc. Shareholders’ Equity
758,393
331,731
Noncontrolling interests
17,974
445,174
Total Shareholders’ Equity
776,367
776,905
Total Liabilities, Redeemable Noncontrolling Interests and Shareholders’ Equity
$
4,214,547
$
3,908,221
SCHEDULE 13 STAGWELL INC. UNAUDITED SUMMARY CASH FLOW DATA (amounts in thousands)
Years Ended December 31,
2025
2024
Cash flows from operating activities:
Net income
$
30,626
$
25,044
Adjustments to reconcile net income to cash provided by operating activities:
Stock-based compensation
54,095
52,161
Depreciation and amortization
171,249
151,652
Amortization of right-of-use lease assets and lease liability interest
67,495
75,117
Impairment and other (gains) losses
(3,116
)
1,715
Deferred income taxes
10,439
(10,686
)
Adjustment to deferred acquisition consideration
(7,467
)
23,005
Loss (gain) on sale of business
2,245
–
Bargain purchase gain
(9,937
)
–
Other, net
7,519
7,622
Changes in working capital:
Accounts receivable
28,787
8,465
Expenditures billable to clients
12,012
(54,350
)
Other current assets
(51,534
)
(6,200
)
Accounts payable
73,573
24,438
Accrued expenses and other liabilities
(42,244
)
(28,658
)
Advance billings
25,574
(22,651
)
Current portion of lease liabilities – operating leases
(76,465
)
(83,905
)
Deferred acquisition related payments
(1,823
)
(19,910
)
Net cash provided by operating activities
291,028
142,859
Cash flows from investing activities:
Capitalized software
(67,489
)
(35,094
)
Capital expenditures
(43,741
)
(18,912
)
Acquisitions, net of cash acquired
(6,179
)
(103,254
)
Proceeds from sale of business, net
10,850
–
Other
(7,119
)
(5,212
)
Net cash used in investing activities
(113,678
)
(162,472
)
Cash flows from financing activities:
Repayment of borrowings under revolving credit facility
(2,026,000
)
(1,755,000
)
Proceeds from borrowings under revolving credit facility
1,999,326
1,960,000
Shares repurchased and cancelled
(134,261
)
(108,249
)
Distributions to noncontrolling interests
(9,662
)
(26,723
)
Payment of deferred consideration
(33,343
)
(29,774
)
Purchase of noncontrolling interest
–
(3,316
)
Debt financing and other costs
(6,077
)
–
Net cash (used in) provided by financing activities
(210,017
)
36,938
Effect of exchange rate changes on cash and cash equivalents
5,865
(5,723
)
Net increase (decrease) in cash and cash equivalents
ROYERSFORD, PA – March 09, 2026 – PRESSADVANTAGE –
Beacon of Life Chiropractic highlights the professional background of Dr. Megan McClimon, one of its co-founders, who brings experience from leading chiropractic offices in the Southeast United States to the Royersford community. Her path includes academic achievements and leadership roles, emphasizing neurologically-based approaches to spinal health. This focus supports the practice’s delivery of natural methods for musculoskeletal issues.
Dr. Megan McClimon grew up in Okemos, Michigan, developing an interest in health through sports. She earned a third-degree black belt in Taekwondo and became a National Champion in 2002. This led to a Bachelor of Science in Movement Science from the University of Michigan. Early exposure to chiropractic came via her father’s role with the Michigan Chiropractic Society, and she worked as a chiropractic assistant for seven years. Personal health improvements from such care motivated her professional pursuit.
Dr. McClimon graduated Magna Cum Laude with a Doctorate in Chiropractic from Life University in Georgia. Her education centered on neurologically-based care, focusing on the nervous system’s health influence. She led two large family-based clinics in the Atlanta area for two years, applying scientific techniques.
In Pennsylvania, Dr. McClimon co-founded Beacon of Life Chiropractic with Dr. Daniel McClimon. The practice provides spinal adjustments to realign vertebrae and reduce nerve pressure, addressing back pain, neck discomfort, and headaches. Neurologically-based chiropractic seeks to optimize nervous system function, complementing medical approaches that may use medications or surgery. This philosophy views the nervous system as central, while recognizing chiropractic as complementary with varying evidence support.
Systematic reviews indicate spinal manipulation therapy’s effectiveness for spine pain. A review in the Journal of Orthopaedic & Sports Physical Therapy found most procedures equal to guideline interventions and slightly more effective than others. Another in Frontiers in Neurology showed increased corticomotor excitability in lower limb muscles post-adjustment in chronic stroke patients. A Nature Scientific Reports study reported strength increases in weak muscles after a single session in stroke patients. For low back pain, a BMJ meta-analysis noted small effects for short-term relief compared to non-recommended therapies. A JAMA review associated manipulation with modest improvements in acute low back pain. A Spine Journal meta-analysis showed manipulation reduced pain and disability versus active comparators like exercise. A Cochrane review indicated small pain reduction and moderate function improvement versus sham.
Patient outcomes data reflect these findings. A JAMA Network Open study found moderate short-term improvements in low back pain intensity and disability when chiropractic added to medical care. Satisfaction surveys show higher ratings for chiropractic than medical care for back pain. A PMC article noted patients nearly twice as likely satisfied with chiropractic versus medical doctors.
Individual cases at Beacon of Life Chiropractic serve as examples, distinct from evidence-based data. One patient regained hand function through adjustments and SoftWave therapy, improving work ability. Another with chronic issues restored mobility for family activities. A neuropathy patient reported life improvements. These anecdotes illustrate potential experiences, while outcomes vary; coordination with medical professionals is advised.
The team includes chiropractors with varied backgrounds. Dr. Diana Harkness transitioned after Lyme Disease challenges, informed by athletic training. Dr. Benjamin Linkel applies seven years in pain relief, drawing from exercise physiology. Support staff handle operations, therapies, and education.
Beacon of Life Chiropractic uses techniques for migraines, carpal tunnel, and sports injuries. Adjustments alleviate nerve pressure; therapies like acoustic waves reduce inflammation. Wellness programs address posture, immune function, and energy via prevention.
“Neurologically-based care complements other approaches by promoting natural recovery through nervous system optimization,” said Dr. Megan McClimon, co-founder and chiropractor at Beacon of Life Chiropractic.
The practice develops tailored plans via evaluations, prioritizing non-invasive methods. Staff certifications in massage and counseling enhance services.
“Integrating evidence with chiropractic principles supports patient well-being,” said Dr. Daniel McClimon, co-founder and chiropractor at Beacon of Life Chiropractic.
Beacon of Life Chiropractic serves as a resource for pain relief from injuries or chronic conditions. The structure facilitates assessments and support, aiding community health.
Founded by Dr. Megan McClimon and Dr. Daniel McClimon, the practice offers adjustments, therapy, and resources for conditions. It emphasizes patient-centered methods leveraging healing abilities.
This highlight of Dr. McClimon’s background underscores informed care dedication. Her journey demonstrates applied knowledge in operations.
Beacon of Life Chiropractic provides services in Royersford, Pennsylvania, addressing musculoskeletal concerns naturally.
###
For more information about Beacon of Life Chiropractic, contact the company here:
Beacon of Life Chiropractic Daniel McClimon, DC (610) 474-2481 info@gobeaconhealth.com 70 Buckwalter Rd Ste 412, Royersford, PA 19468
LOS ANGELES, CA – March 09, 2026 – PRESSADVANTAGE –
New California law allows courts to consider gun restriction violations when determining child custody in domestic violence cases. Beginning January 1, 2026, California courts can consider firearm restriction violations when making child custody decisions in divorce cases involving domestic violence, according to Charles M. Green, APLC, a Los Angeles family law firm. The amendment to Family Code §3044 gives judges another tool to evaluate whether a parent poses a risk to children—and creates new legal consequences for those who fail to comply with gun surrender orders.
The change comes as domestic violence continues to affect families across Los Angeles County, where an average of 36 intimate partner violence-related homicides occur each year. According to the Los Angeles County Department of Public Health, 20 percent of women and 13 percent of men in the county report being physically or sexually abused by an intimate partner. Nationally, approximately 847,000 cases of intimate partner violence against victims age 12 and older are reported annually.
Under the updated law, a parent’s illegal access to firearms—including possession that violates restraining orders, probation conditions, or state and federal statutes—can now directly influence custody outcomes. Courts already presume against granting custody to a parent who has committed domestic violence. The new provision strengthens that presumption by treating firearm violations as evidence of ongoing risk.
“A parent who violates a firearm restriction during a custody case isn’t just facing criminal charges—they’re handing the other side a powerful argument for sole custody,” said Charles M. Green, a Certified California Family Law Specialist and licensed CPA with 27 years of experience in California divorce proceedings.
The law also works in conjunction with other recent legislative changes. Assembly Bill 2759, effective January 2025, requires immediate surrender of all firearms and ammunition when a domestic violence protective order is issued. Courts are now required to search the Department of Justice Automated Firearms System before issuing or denying protective orders—meaning violations are more likely to be discovered and documented. Assembly Bill 2308, also effective January 2025, extended the maximum duration of domestic violence restraining orders from five years to ten years, with the possibility of permanent orders in certain cases.
For parents navigating child custody disputes where domestic violence is alleged, compliance with firearm restrictions has become a critical factor in case strategy. A single violation—even one that does not result in criminal prosecution—can now be cited as grounds to deny custody or reduce parenting time. The burden falls on the accused parent to demonstrate that granting custody would be in the child’s best interest.
“If you’re going through a divorce involving domestic violence allegations, the first thing you need to do is understand exactly what firearm restrictions apply to you—and follow them to the letter,” Green added. “The court isn’t going to give you the benefit of the doubt. Compliance is everything.”
The intersection of firearm law and family law reflects California’s broader legislative focus on child safety in custody proceedings. Piqui’s Law, enacted in 2023, already restricts reunification programs that place children with parents who have histories of abuse. The firearm provision adds another layer of protection by ensuring that violations of gun restrictions carry consequences beyond criminal penalties.
Parents facing custody disputes involving domestic violence allegations should consult with an experienced family law attorney to understand how these new laws may affect their case. Early legal guidance can help protect parental rights while ensuring full compliance with court orders and statutory requirements.
###
For more information about Charles M. Green, APLC, contact the company here:
Charles M. Green, APLC Charles M. Green 213-387-4508 miguel@greenlawcorp.com 3699 Wilshire Blvd Ste 700 Los Angeles, CA 90010