Dr. Raza Bokhari, Executive Chairman & CEO will participate in panel discussions and highlight Company’s AI-enabled Drug Development Strategy
PHILADELPHIA, PA / ACCESS Newswire / March 10, 2026 / Medicus Pharma Ltd. (NASDAQ:MDCX) (“Medicus” or the “Company”), a biotech/life sciences company focused on advancing the clinical development programs of novel and potentially disruptive therapeutics assets, is pleased to announce its participation in the Longwood Miami CEO forum being held March 11-13, 2026, at the Ritz-Carlton Key Biscayne.
Dr. Raza Bokhari, Executive Chairman & CEO of Medicus, will serve on a panel titled “Accelerating the Path to Patient Care” and will highlight company’s AI enabled Drug development strategy designed to make clinical trials not only cost efficient but also time efficient.
Other panelists include Lindsay Edwards, CTO & President of Platform, Relation Therapeutics; Julie Gerberding, CEO, Foundation for the NIH and Former Director, CDC; and Gilmore O’Neill, CEO, Editas Medicine. The panel will be moderated by Jon Cohen, Head of Life Sciences Go-To-Market at ServiceNow.
Longwood Miami CEO is an invitation-only event, that brings together Industry leaders, innovators, thought leaders and opinion makers, who will speak on curated fireside chats, roundtables, and discussion panels.
Notable Participants in the conference include Brent Saunders (CEO, Bausch + Lomb), Chris Boshoff (CSO & President, R&D, Pfizer), Rob Califf (former Commissioner, FDA), Sidney Taurel (Chair Emeritus, Lilly), Bill Mezzanotte (Head, R&D, CSL), David Redfern (President, Corporate Development, GSK), Pablo Cagnoni (Head, R&D, Incyte), Julie Gerberding (former Director, CDC), Bill Hait (Chief Scientific Advisor, AACR; former CMO, J&J), Jeremy Levin (Chair & CEO, Ovid Therapeutics), David Meek (former CEO, Ipsen; CEO, Genetix), Frank Nestle (CEO, Deerfield Discovery), Benj Garrett (Managing Director, Stifel), among others.
Medicus Pharma Ltd. (Nasdaq:MDCX) is a precision-guided biotech/life sciences company focused on accelerating the clinical development programs of novel and potentially disruptive therapeutics assets. The Company is actively engaged in multiple countries across three continents.
SkinJect Inc., a wholly owned subsidiary of Medicus Pharma Ltd., is a development-stage life sciences company focused on commercializing a novel, non-invasive treatment for basal cell skin cancer using a patented dissolvable microneedle patch to deliver a chemotherapeutic agent to eradicate tumor cells.
In August 2025, the Company announced its entry into a non-binding memorandum of understanding (MoU) with Helix Nanotechnologies, Inc. (HelixNano), a Boston-based biotech company focused on developing a proprietary advanced mRNA platform, in respect of their shared mutual interest in the development or commercial arrangement contemplated by the MoU. The MoU is non-binding and shall not be construed to obligate either party to proceed with a joint venture or any further development or commercial arrangement, unless and until definitive agreements are executed.
In August 2025, the Company completed the acquisition of Antev, a UK-based late clinical stage biotech company, developing Teverelix, a next-generation gonadotrophin-releasing hormone (GnRH) antagonist, as a first-in-market product for cardiovascular high-risk advanced prostate cancer patients and patients with first acute urinary retention relapse (AURr) episodes due to enlarged prostate.
Unlike GnRH agonists, which can cause an initial surge in testosterone levels, Teverelix directly suppresses sex hormone production without this surge, potentially reducing cardiovascular risks. This mechanism is particularly beneficial for patients with existing cardiovascular conditions. Teverelix is formulated as a microcrystalline suspension, allowing for sustained release and a six-week dosing interval, which may improve patient compliance and outcomes.
In October 2025, the Company announced a strategic collaboration with the Gorlin Syndrome Alliance (GSA) to advance compassionate access to SkinJect for patients suffering from Gorlin Syndrome, also known as nevoid basal cell carcinoma syndrome.
Under the collaboration, Medicus and the GSA will jointly pursue the Expanded Access IND Program with the FDA to allow patients with multiple, recurrent, or inoperable basal cell carcinomas (BCCs) to access SkinJect under physician-supervised treatment protocols. The initiative aims to establish a framework for expanded access while collecting valuable real-world safety and tolerability data to inform future regulatory filings. It will also more tightly integrate patient community-led insights and data into the design, monitoring, and long-term development of SkinJect in this rare disease population.
In November 2025, the Company received full regulatory and ethical approvals in the United Kingdom to expand its ongoing Phase 2 clinical study (SKNJCT-003) evaluating D-MNA to non-invasively treat BCC of the skin. The approvals were issued by the Medicines and Healthcare products Regulatory Agency (MHRA), the Health Research Authority (HRA) and the Wales Research Ethics Committee (WREC). The MHRA approval followed a comprehensive scientific review of the Investigational Medicinal Product Dossier (IMPD) and protocol. The WREC issued a favorable ethical opinion, and the HRA granted study-wide governance approval, confirming compliance with UK Good Clinical Practice and National Health Service capacity and capability standards.
In December 2025, the Company announced that it has successfully completed enrolment of 90 patients in the United States for Phase 2 clinical study (SKNJCT-003) evaluating D-MNA to non-invasively treat BCC of the skin. The Company expects to secure an end-of-Phase 2 meeting with the FDA in the first half of 2026.
In December 2025, Medicus announced a non-binding letter of intent with Reliant AI Inc., a decision-intelligence company specializing in generative AI for the life sciences industry, to collaborate on the development of an AI-driven clinical data analytics platform. Subject to execution of definitive agreements, the platform is expected to support capital-efficient clinical development through data-driven dynamic clinical-site selection, patient stratification and enrollment forecasting. The initial phase of the collaboration is expected to support an upcoming Teverelix clinical study planned for 2026, with potential expansion into later-stage development programs in collaboration with a strategic partner.
In February 2026, the Company announced that it has received “study may proceed” clearance from the U.S. Food and Drug Administration (FDA) to initiate its Phase 2b dose-optimization study of Teverelix®, an investigational next generation long-acting GnRH antagonist, in men with advanced prostate cancer (APC).
Cautionary Notice on Forward-Looking Statements
Certain information in this news release constitutes “forward-looking information” under applicable securities laws. “Forward-looking information” is defined as disclosure regarding possible events, conditions or financial performance that is based on assumptions about future economic conditions and courses of action and includes, without limitation, statements regarding the Company’s leadership and prospects, the collaboration with GSA including the potential benefits thereof for GSA, those suffering with Gorlin Syndrome and Medicus (including as it relates to the development of SkinJect™), ability to be approved for the Expanded Access IND Program to enable those suffering with Gorlin Syndrome to access SkinJect™ under physician-supervised treatment protocols, the development of Teverelix and expectations concerning, and future outcomes relating to, the development, advancement and commercialization of Teverelix for AURr, high CV risk prostate cancer, women’s health indications like endometriosis, and the potential market opportunities related thereto, the MOU, including the potential signing of definitive agreements between Medicus and HelixNano and the development of thermostable infectious diseases vaccines by combining HelixNano’s proprietary mRNA vaccine platform with Medicus’s proprietary microneedle array (MNA) delivery platform, the Company’s aim to fast-track the clinical development program and convert the SKNJCT-003 exploratory clinical trial into a pivotal clinical trial, and approval from the FDA and the timing thereof, including with respect to the Company’s submission for approval in the FDA Commissioner’s National Priority Voucher program, plans and expectations concerning, and future outcomes relating to, the development, advancement and commercialization of SkinJect through SKNJCT-003 and SKNJCT-004, and the potential market opportunities related thereto, the Company’s expectations regarding reported efficacy findings and whether there will be material changes to its reported SKNJCT-003 topline results and to secure an EOP2 meeting with the FDA in the first half of 2026, entry into definitive documents with Reliant and the expected terms thereof, engaging in proposed Medicus-sponsored studies currently contemplated in the Reliant non-binding letter of intent and the expected benefits thereof, the expansion of SKNJCT-003 into the United Kingdom and the potential benefits therefrom, the advancement of the SKNJCT-004 study and the potential results of and benefits of such study. Forward-looking statements are often but not always, identified by the use of such terms as “may”, “on track”, “aim”, “might”, “will”, “will likely result”, “could,” “designed,” “would”, “should”, “estimate”, “plan”, “project”, “forecast”, “intend”, “expect”, “anticipate”, “believe”, “seek”, “continue”, “target”, “potential” or the negative and/or inverse of such terms or other similar expressions. These statements involve known and unknown risks, uncertainties and other factors, which may cause actual results, performance or achievements to differ materially from those expressed or implied by such statements, including those risk factors described in the Company’s annual report on form 10-K for the year ended December 31, 2024 (the “Annual Report”), and in the Company’s other public filings on EDGAR and SEDAR+, which may impact, among other things, the trading price and liquidity of the Company’s common shares. Forward-looking statements contained in this news release are expressly qualified by this cautionary statement and reflect our expectations as of the date hereof and thus are subject to change thereafter. The Company disclaims any intention or obligation to update or revise any forward-looking statements, whether as a result of new information, future events or otherwise, except as required by law. Readers are further cautioned not to place undue reliance on forward-looking statements as there can be no assurance that the plans, intentions or expectations upon which they are placed will occur. Such information, although considered reasonable by management at the time of preparation, may prove to be incorrect and actual results may differ materially from those anticipated.
FY25 EPS of $0.08; FY25 Adjusted EPS growth of 5% to $0.83
YoY Increase in Cash Flow from Operations of $148 million; Free Cash Flow more than doubled to $187 million
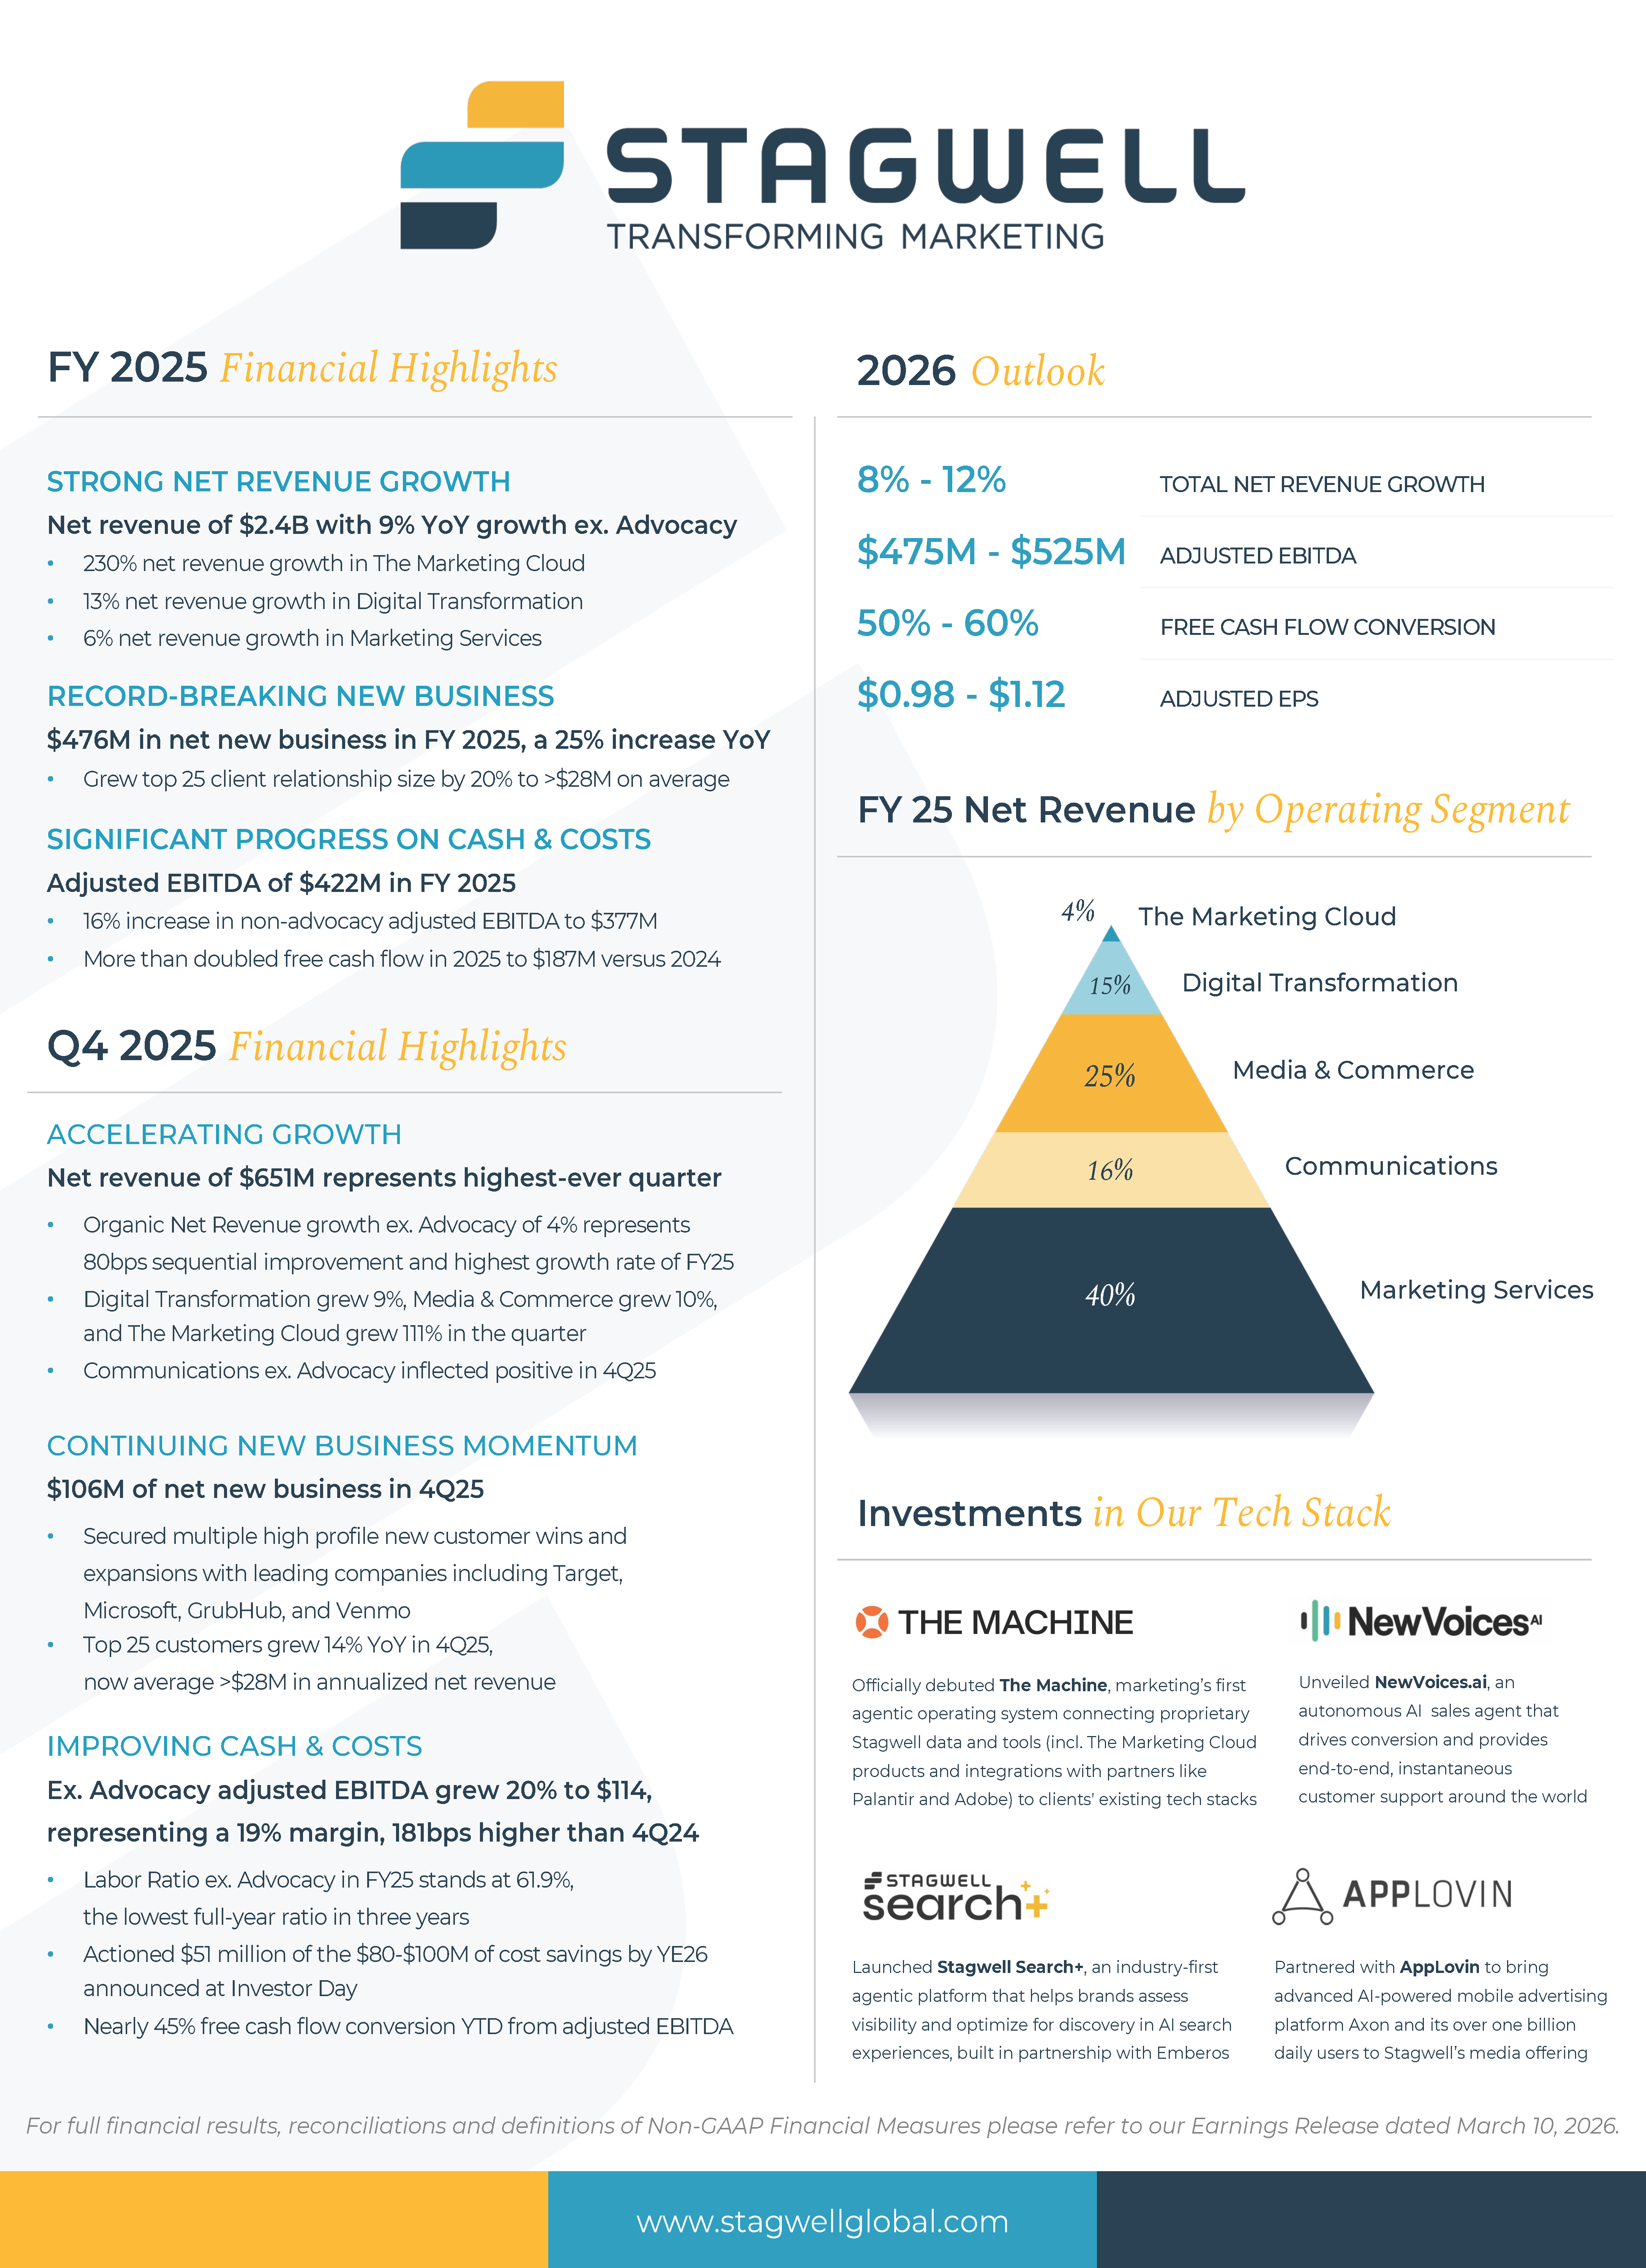
FY25 YoY Revenue Growth of 2%; FY25 YoY Net Revenue Growth of 6%
FY25 YoY Net Revenue Growth excluding Advocacy of 9%, Digital Transformation Net Revenue Growth of 13%, Marketing Services Net Revenue Growth of 6%
The Marketing Cloud delivered YoY Net Revenue Growth of 230%
FY25 Net Income Attributable to Stagwell Inc. Common Shareholders of $29 million; FY25 Adjusted EBITDA of $422 million; FY25 Adjusted EBITDA ex. Advocacy YoY Growth of 16% to $377 million
Net New Business of $106 million in Q4; LTM Net New Business of $476 million
Company Announces $350 Million Increase in Stock Repurchase Program; $400 Million Now Available Under the Program
Guidance for 2026 of Total Net Revenue Growth of 8% to 12%; Adjusted EBITDA of $475 million to $525 million; Free Cash Flow Conversion of 50% to 60%
NEW YORK CITY, NY / ACCESS Newswire / March 10, 2026 / (NASDAQ:STGW) – Stagwell Inc. (“Stagwell”) today announced financial results for the year ended December 31, 2025.
FOURTH QUARTER AND FULL YEAR RESULTS:
Q4 Revenue of $807 million, an increase of 2% versus the prior year period; FY25 Revenue of $2,909 million, an increase of 2% versus the prior year period;
Q4 Revenue ex. Advocacy of $742 million, an increase of 12% versus the prior year period; FY25 Revenue ex. Advocacy of $2,689 million, an increase of 9% versus the prior year period;
Q4 Net Revenue of $651 million, an increase of 3% versus the prior year period; FY25 Net Revenue of $2,428 million, an increase of 6% versus the prior year period;
Q4 Net Revenue ex. Advocacy of $609 million, an increase of 8% versus the prior year period; FY25 Net Revenue ex. Advocacy of $2,282 million, an increase of 9% versus the prior year period;
Q4 Net Income attributable to Stagwell Inc. Common Shareholders of $13 million versus $3 million in the prior year period; FY25 Net Income attributable to Stagwell Inc. Common Shareholders of $29 million versus $2 million in the prior year period;
Q4 Adjusted EBITDA of $129 million, an increase of 3% versus the prior year period; FY25 Adjusted EBITDA of $422 million, an increase of 1% versus the prior year period;
Q4 Adjusted EBITDA Margin of 20% on net revenue; FY25 Adjusted EBITDA Margin of 17% on net revenue;
Q4 Earnings Per Share Attributable to Stagwell Inc. Common Shareholders of $0.05 versus $0.03 in the prior year period; FY25 Earnings Per Share Attributable to Stagwell Inc. Common Shareholders of $0.08 versus $0.02 in the prior year period;
Q4 Adjusted Earnings Per Share attributable to Stagwell Inc. Common Shareholders of $0.30 versus $0.25 in the prior year period; FY25 Adjusted Earnings Per Share attributable to Stagwell Inc. Common Shareholders of $0.83 versus $0.79 in the prior year period;
YTD Net Cash provided by Operating Activities of $291 million versus $143 million in the prior year period;
Net new business of $106 million in the fourth quarter, last twelve-month net new business of $476 million
See “Non-GAAP Financial Measures” below for explanations and reconciliations of the Company’s non-GAAP financial measures.
“In 2025, Stagwell increased its strategic pivot toward AI applications and services, building a powerful foundation for 2026. With accelerating growth ex-advocacy, record net new business, expanding margins and doubled free cash flow, our FY25 results prove our strategy is working,” shared Mark Penn, Stagwell’s Chairman and CEO. “We see great opportunity in 2026 to capitalize on an industry distracted by restructurings and mergers, and bolster our position as a winner in the age of AI.”
Ryan Greene, Chief Financial Officer, commented: “2025 marked an inflection year for Stagwell, with clear momentum in the underlying business and improving efficiency contributing to strong year-over-year net revenue, adjusted EBITDA and adjusted EPS growth. Proactive cash management meant we more than doubled our free cash flow in 2025. We expect another strong year in 2026, and will be aggressive in our capital allocation to drive shareholder value.”
Financial Outlook
2026 financial guidance is as follows:
Total Net Revenue growth of 8% to 12%
Adjusted EBITDA of $475 million to $525 million
Free Cash Flow Conversion of 50% to 60%
Adjusted EPS of $0.98 – $1.12
Guidance includes anticipated impact from acquisitions or dispositions.
* The Company has excluded a quantitative reconciliation with respect to the Company’s 2026 guidance under the “unreasonable efforts” exception in Item 10(e)(1)(i)(B) of Regulation S-K. See “Non-GAAP Financial Measures” below for additional information.
Stock Repurchase Program
On March 4, 2026, the Board of Directors authorized an extension and a $350.0 million increase in the size of our previously approved stock repurchase program (the “Repurchase Program”). Under the Repurchase Program, as amended, we may repurchase up to an aggregate of $725.0 million of shares of our outstanding Class A common stock, par value $0.001 per share (“Class A Common Stock”), with any previous purchases under the Repurchase Program continuing to count against that limit. With the increase, we have a total of approximately $400.0 million available for repurchases. The Repurchase Program will expire on March 4, 2029.
Video Webcast
Management will host a video webcast on Tuesday, March 10, 2026, at 8:30 a.m. (ET) to discuss results for Stagwell Inc. for the year ended December 31, 2025. The video webcast will be accessible at https://edge.media-server.com/mmc/p/3x58p928/. An investor presentation has been posted on our website at www.stagwellglobal.com and may be referred to during the webcast.
A recording of the webcast will be accessible one hour after the webcast and available for ninety days at www.stagwellglobal.com.
Stagwell Inc.
Stagwell is the challenger network built to transform marketing. We deliver scaled creative performance for the world’s most ambitious brands, connecting culture-moving creativity with leading-edge technology to harmonize the art and science of marketing. Led by entrepreneurs, our specialists in 45+ countries are unified under a single purpose: to drive effectiveness and improve business results for their clients. Join us at www.stagwellglobal.com.
In addition to its reported results, Stagwell Inc. has included in this earnings release certain financial results that the Securities and Exchange Commission (SEC) defines as “non-GAAP Financial Measures.” Management believes that such non-GAAP financial measures, when read in conjunction with the Company’s reported results, can provide useful supplemental information for investors analyzing period to period comparisons of the Company’s results. Such non-GAAP financial measures include the following:
(1) Organic Net Revenue: “Organic net revenue growth” and “Organic net revenue decline” reflects the year-over-year change in the Company’s reported net revenue attributable to the Company’s management of the entities it owns. We calculate organic net revenue growth (decline) by subtracting the net impact of acquisitions (divestitures) and the impact of foreign currency exchange fluctuations from the aggregate year-over-year increase or decrease in the Company’s reported net revenue. The net impact of acquisitions (divestitures) reflects the year-over-year change in the Company’s reported net revenue attributable to the impact of all individual entities that were acquired or divested in the current and prior year. We calculate impact of an acquisition as follows: (a) for an entity acquired during the current year, we present the entity’s current period reported revenue as the impact of the acquisition in the current year; and (b) for an entity acquired in the prior year, we present an amount equal to the entity’s current year net revenue for the same period during which we didn’t own the entity in the prior year as the impact of the acquisition in the current year. We calculate impact of a divestiture as follows: (a) for a divestiture in the current year, we present the entity’s prior year net revenue for the same period during which we no longer owned it in the current year as impact of the divestiture in the current year; and (b) for a divestiture in the prior year, we present the entity’s prior year net revenue for the period during which we owned it in the prior year as impact of the divestiture in the current year. We calculate the impact of any acquisition or divestiture without adjusting for foreign currency exchange fluctuations. The impact of foreign currency exchange fluctuations reflects the year-over-year change in the Company’s reported net revenue attributable to changes in foreign currency exchange rates. We calculate the impact of foreign currency exchange fluctuations for the portion of the reporting period in which we recognized revenue from a foreign entity in both the current year and the prior year. The impact is calculated as the difference between (1) reported prior period net revenue (converted to U.S. dollars at historical foreign currency exchange rates) and (2) prior period net revenue converted to U.S. dollars at current period foreign exchange rates.
(2) Net New Business: Estimate of annualized revenue for new wins less annualized revenue for losses incurred in the period.
(3) Adjusted EBITDA: defined as Net income (loss) attributable to Stagwell Inc. common shareholders excluding non-operating income or expense to achieve operating income (loss), plus depreciation and amortization, stock-based compensation, deferred acquisition consideration adjustments, impairment and other losses, and other items. Other items primarily includes restructuring, certain system implementation, working capital administrative fees and acquisition-related expenses. Adjusted EBITDA for our reportable segments is reconciled to Operating Income (Loss), as Net Income (Loss) is not a relevant reportable segment financial metric.
(4) Adjusted Diluted EPS” is defined as (i) Net income (loss) attributable to Stagwell Inc. common shareholders, plus net income (loss) attributable to Class C shareholders, excluding the impact of amortization expense, impairment and other losses, stock-based compensation, deferred acquisition consideration adjustments, discrete tax items, and other items (as defined above), based on total consolidated amounts, then allocated to Stagwell Inc. common shareholders and Class C shareholders, based on their respective income allocation percentage using a normalized effective income tax rate divided by (ii) the diluted weighted average shares outstanding. The diluted weighted average shares outstanding is calculated as (a) the diluted weighted average number of common shares outstanding plus (b) the shares of Class C Common Stock as if converted to shares of Class A Common Stock if not included because they were anti-dilutive.
(5) Free Cash Flow: defined as Net cash provided from operations less normalized capital expenditures and capitalized software. Free Cash Flow Conversion is the percentage of adjusted EBITDA.
Included in this earnings release are tables reconciling reported Stagwell Inc. results to arrive at certain of these non-GAAP financial measures.
This document contains forward-looking statements within the meaning of Section 27A of the Securities Act of 1933, as amended (the “Securities Act”), and Section 21E of the Securities Exchange Act of 1934, as amended (the “Exchange Act”). The Company’s representatives may also make forward-looking statements orally or in writing from time to time. Statements in this document that are not historical facts, including, statements about the Company’s beliefs and expectations, future financial performance, growth, and future prospects, the Company’s strategy, business and economic trends and growth, technological leadership and differentiation, potential and completed acquisitions, anticipated and actual operating efficiencies and synergies and estimates of amounts for redeemable noncontrolling interests and deferred acquisition consideration, constitute forward-looking statements. Forward-looking statements, which are generally denoted by words such as “ability,” “aim,” “anticipate,” “assume,” “believe,” “better,” “build,” “consider,” “continue,” “could,” “develop,” “drive,” “enhance,” “estimate,” “expect,” “focus,” “forecast,” “future,” “grow,” “guidance,” “improve,” “intend,” “likely,” “maintain,” “may,” “ongoing,”, “outlook,” “plan,” “position,” “possible,” “potential,” “probable,” “project,” “seek,” “should,” “target,” “will,” “would” or the negative of such terms or other variations thereof and terms of similar substance used in connection with any discussion of current plans, estimates and projections are subject to change based on a number of factors, including those outlined in this section.
Forward-looking statements in this document are based on certain key expectations and assumptions made by the Company. Although the management of the Company believes that the expectations and assumptions on which such forward-looking statements are based are reasonable, undue reliance should not be placed on the forward-looking statements because the Company can give no assurance that they will prove to be correct. The material assumptions upon which such forward-looking statements are based include, among others, assumptions with respect to general business, economic and market conditions, the competitive environment, anticipated and unanticipated tax consequences and anticipated and unanticipated costs. These forward-looking statements are based on current plans, estimates and projections, and are subject to change based on a number of factors, including those outlined in this section. These forward-looking statements are subject to various risks and uncertainties, many of which are outside the Company’s control. Therefore, you should not place undue reliance on such statements. Forward-looking statements speak only as of the date they are made, and the Company undertakes no obligation to update publicly any of them in light of new information or future events, if any.
Forward-looking statements involve inherent risks and uncertainties. A number of important factors could cause actual results to differ materially from those contained in any forward-looking statements. Such risk factors include, but are not limited to, the following:
risks associated with international, national and regional unfavorable economic conditions, including the effect of changing tariff and other trade policies, inflation and other macroeconomic factors that could affect the Company or its clients;
demand for the Company’s services, which may precipitate or exacerbate other risks and uncertainties;
inflation and actions taken by central banks to counter inflation;
the Company’s ability to attract new clients and retain existing clients;
the impact of a reduction in client spending and changes in client advertising, marketing and corporate communications requirements;
financial failure of the Company’s clients;
the Company’s ability to retain and attract key employees;
the Company’s ability to compete in the markets in which it operates;
the Company’s ability to achieve its cost saving initiatives;
the Company’s implementation of strategic initiatives;
the Company’s ability to remain in compliance with its debt agreements and the Company’s ability to finance its contingent payment obligations when due and payable, including but not limited to those relating to redeemable noncontrolling interests, deferred acquisition consideration and profit interests;
the Company’s ability to manage its growth effectively;
the Company’s ability to identify and complete acquisitions or other strategic transactions that complement and expand the Company’s business capabilities and successfully integrate newly acquired businesses into the Company’s operations, retain key employees, and realize cost savings, synergies and other related anticipated benefits within the expected time period;
the Company’s ability to identify and complete divestitures and to achieve the anticipated benefits therefrom;
the Company’s ability to develop products incorporating new technologies, including augmented reality, artificial intelligence, and virtual reality, and realize benefits from such products;
the Company’s use of artificial intelligence, including generative artificial intelligence;
adverse tax consequences for the Company, its operations and its stockholders, that may differ from the expectations of the Company, including that recent or future changes in tax laws, potential changes to corporate tax rates in the United States and disagreements with tax authorities on the Company’s determinations that may result in increased tax costs;
adverse tax consequences in connection with the business combination that formed the Company in August 2021, including the incurrence of material Canadian federal income tax (including material “emigration tax”);
the Company’s ability to maintain an effective system of internal control over financial reporting, including the risk that the Company’s internal controls will fail to detect misstatements in its financial statements;
the Company’s ability to accurately forecast its future financial performance and provide accurate guidance;
the Company’s ability to protect client data from security incidents or cyberattacks;
economic disruptions resulting from war and other economic and geopolitical tensions (such as the ongoing military conflicts in Iran and the Middle East, and between Russia and Ukraine), terrorist activities, natural disasters, public health events, and tariff and trade policies;
stock price volatility; and
foreign currency fluctuations.
Investors should carefully consider these risks factors, the additional risk factors outlined under the caption “Risk Factors” in this Form 10-K, and in the Company’s other filings with the Securities and Exchange Commission (the”SEC”) which are accessible on the SEC’s website at www.sec.gov.
SCHEDULE 1 STAGWELL INC. UNAUDITED CONSOLIDATED STATEMENTS OF OPERATIONS (amounts in thousands, except per share amounts)
Three Months Ended December 31,
Year Ended December 31,
2025
2024
2025
2024
Revenue
$
807,444
$
788,708
$
2,909,000
$
2,841,216
Operating Expenses
Cost of services
503,718
502,522
1,845,958
1,842,978
Office and general expenses
203,481
203,887
732,326
711,803
Depreciation and amortization
43,614
38,771
171,249
151,652
Impairment and other losses
–
–
466
1,715
750,813
745,180
2,749,999
2,708,148
Operating Income
56,631
43,528
159,001
133,068
Other income (expenses):
Interest expense, net
(24,431
)
(24,038
)
(96,438
)
(92,317
)
Foreign exchange, net
(1,156
)
645
(1,640
)
(1,656
)
Gain (loss) on sale of business
(2,245
)
–
(2,245
)
–
Bargain purchase gain
9,937
–
9,937
–
Other, net
2,314
(547
)
171
(1,372
)
(15,581
)
(23,940
)
(90,215
)
(95,345
)
Income before income taxes and equity in earnings of non-consolidated affiliates
41,050
19,588
68,786
37,723
Income tax expense
24,321
3,741
38,271
13,182
Income before equity in earnings of non-consolidated affiliates
16,729
15,847
30,515
24,541
Equity in income of non-consolidated affiliates
93
–
111
503
Net income
16,822
15,847
30,626
25,044
Net income attributable to noncontrolling and redeemable noncontrolling interests
(4,162
)
(12,612
)
(1,525
)
(22,785
)
Net income attributable to Stagwell Inc. common shareholders
$
12,660
$
3,235
$
29,101
$
2,259
Earnings Per Common Share:
Basic
$
0.05
$
0.03
$
0.13
$
0.02
Diluted
$
0.05
$
0.03
$
0.08
$
0.02
Weighted Average Number of Common Shares Outstanding:
Basic
251,650
109,266
220,608
110,890
Diluted
258,997
115,147
264,523
115,752
SCHEDULE 2 STAGWELL INC. UNAUDITED COMPONENTS OF NET REVENUE CHANGE (amounts in thousands)
Net Revenue – Components of Change
Change
Three Months Ended December 31, 2024
Foreign Currency
Net Acquisitions (Divestitures)
Organic (1)
Total Change
Three Months Ended December 31, 2025
Organic
Total
Marketing Services
$
240,262
$
2,017
$
1,315
$
1,215
$
4,547
$
244,809
0.5
%
1.9
%
Digital Transformation
84,570
(130
)
5,419
2,335
7,624
92,194
2.8
%
9.0
%
Media & Commerce
161,720
1,745
3,154
11,546
16,445
178,165
7.1
%
10.2
%
Communications
131,736
385
–
(23,796
)
(23,411
)
108,325
(18.1
)%
(17.8
)%
The Marketing Cloud
13,122
485
8,706
5,404
14,595
27,717
41.2
%
111.2
%
Corporate, eliminations and other
(1,787
)
–
–
1,410
1,410
(377
)
(78.9
)%
(78.9
)%
$
629,623
$
4,502
$
18,594
$
(1,886
)
$
21,210
$
650,833
(0.3
)%
3.4
%
(1) See Non-GAAP Financial Measures section above for the definition of Organic Net Revenue.
SCHEDULE 3 STAGWELL INC. UNAUDITED COMPONENTS OF NET REVENUE CHANGE (amounts in thousands)
Net Revenue – Components of Change
Change
Year Ended December 31, 2024
Foreign Currency
Net Acquisitions (Divestitures)
Organic (1)
Total Change
Year Ended December 31, 2025
Organic
Total
Marketing Services
$
905,117
$
3,491
$
9,788
$
41,280
$
54,559
$
959,676
4.6
%
6.0
%
Digital Transformation
324,183
(405
)
13,615
29,779
42,989
367,172
9.2
%
13.3
%
Media & Commerce
601,503
3,396
5,829
(708
)
8,517
610,020
(0.1
)%
1.4
%
Communications
435,626
547
29,002
(71,744
)
(42,195
)
393,431
(16.5
)%
(9.7
)%
The Marketing Cloud
32,265
941
62,229
11,051
74,221
106,486
34.3
%
230.0
%
Corporate, eliminations and other
(2,032
)
–
–
(7,082
)
(7,082
)
(9,114
)
NM
NM
$
2,296,662
$
7,970
$
120,463
$
2,576
$
131,009
$
2,427,671
0.1
%
5.7
%
(1) See Non-GAAP Financial Measures section above for the definition of Organic Net Revenue.
SCHEDULE 4 STAGWELL INC. UNAUDITED SEGMENT OPERATING RESULTS (amounts in thousands)
For the Three Months Ended December 31, 2025
Marketing Services
Digital Transformation
Media & Commerce
Communications
The Marketing Cloud
Corporate, Elimination and Other
Total
Net revenue
$
244,809
$
92,194
$
178,165
$
108,325
$
27,717
$
(377
)
$
650,833
Billable costs
50,555
9,117
32,862
64,037
35
5
156,611
Revenue
295,364
101,311
211,027
172,362
27,752
(372
)
807,444
Billable costs
50,555
9,117
32,862
64,037
35
5
156,611
Staff costs
144,258
63,081
93,713
57,083
14,964
17,055
390,154
Administrative costs
20,304
7,668
25,988
13,799
4,243
12,238
84,240
Unbillable and other costs, net
18,103
154
21,000
2,390
5,511
(1
)
47,157
Adjusted EBITDA(1)
62,144
21,291
37,464
35,053
2,999
(29,669
)
129,282
Stock-based compensation
4,647
1,041
1,127
(435
)
87
3,486
9,953
Depreciation and amortization
12,154
5,924
8,637
6,362
6,078
4,459
43,614
Deferred acquisition consideration
–
4,542
68
(2,143
)
(23
)
–
2,444
Impairment and other losses
–
–
–
–
–
–
–
Other items, net(1)
5,996
366
7,437
1,362
1,042
437
16,640
Operating income (loss)
$
39,347
$
9,418
$
20,195
$
29,907
$
(4,185
)
$
(38,051
)
$
56,631
(1) See Non-GAAP Financial Measures section above for the definition of Adjusted EBITDA and Other items, net.
SCHEDULE 5 STAGWELL INC. UNAUDITED SEGMENT OPERATING RESULTS (amounts in thousands)
For the Year Ended December 31, 2025
Marketing Services
Digital Transformation
Media & Commerce
Communications
The Marketing Cloud
Corporate, Elimination and Other
Total
Net revenue
$
959,676
$
367,172
$
610,020
$
393,431
$
106,486
$
(9,114
)
$
2,427,671
Billable costs
175,145
26,327
80,655
199,146
51
5
481,329
Revenue
1,134,821
393,499
690,675
592,577
106,537
(9,109
)
2,909,000
Billable costs
175,145
26,327
80,655
199,146
51
5
481,329
Staff costs
565,484
247,967
363,031
229,356
68,647
52,411
1,526,896
Administrative costs
105,801
27,267
93,003
50,841
17,613
7,938
302,463
Unbillable and other costs, net
78,333
1,305
64,833
9,300
22,689
(1
)
176,459
Adjusted EBITDA(1)
210,058
90,633
89,153
103,934
(2,463
)
(69,462
)
421,853
Stock-based compensation
19,716
4,122
4,191
6,325
628
19,113
54,095
Depreciation and amortization
52,295
23,174
30,263
25,711
23,514
16,292
171,249
Deferred acquisition consideration
(4,784
)
12,271
3,010
(7,022
)
(10,942
)
–
(7,467
)
Impairment and other losses
–
–
–
222
244
–
466
Other items, net(1)
10,228
1,859
17,549
5,048
3,651
6,174
44,509
Operating income (loss)
$
132,603
$
49,207
$
34,140
$
73,650
$
(19,558
)
$
(111,041
)
$
159,001
(1) See Non-GAAP Financial Measures section above for the definition of Adjusted EBITDA and Other items, net.
SCHEDULE 6 STAGWELL INC. UNAUDITED SEGMENT OPERATING RESULTS (amounts in thousands)
For the Three Months Ended December 31, 2024
Marketing Services
Digital Transformation
Media & Commerce
Communications
The Marketing Cloud
Corporate, Elimination and Other
Total
Net revenue
$
240,262
$
84,570
$
161,720
$
131,736
$
13,122
$
(1,787
)
$
629,623
Billable costs
48,294
2,110
11,719
97,372
–
(410
)
159,085
Revenue
288,556
86,680
173,439
229,108
13,122
(2,197
)
788,708
Billable costs
48,294
2,110
11,719
97,372
–
(410
)
159,085
Staff costs
146,876
60,557
91,108
69,381
10,614
11,685
390,221
Administrative costs
25,300
6,102
22,190
13,646
2,725
3,312
73,275
Unbillable and other costs, net
15,458
605
18,944
2,882
2,860
–
40,749
Adjusted EBITDA(1)
52,628
17,306
29,478
45,827
(3,077
)
(16,784
)
125,378
Stock-based compensation
2,093
(1,480
)
1,866
2,254
157
8,345
13,235
Depreciation and amortization
12,680
5,585
7,301
6,556
3,193
3,456
38,771
Deferred acquisition consideration
3,379
4,221
(1,292
)
9,673
(936
)
–
15,045
Other items, net(1)
8,823
201
1,863
1,403
88
2,421
14,799
Operating income (loss)
$
25,653
$
8,779
$
19,740
$
25,941
$
(5,579
)
$
(31,006
)
$
43,528
(1) See Non-GAAP Financial Measures section above for the definition of Adjusted EBITDA and Other items.
SCHEDULE 7 STAGWELL INC. UNAUDITED SEGMENT OPERATING RESULTS (amounts in thousands)
For the Year Ended December 31, 2024
Marketing Services
Digital Transformation
Media & Commerce
Communications
The Marketing Cloud
Corporate, Elimination and Other
Total
Net revenue
$
905,117
$
324,183
$
601,503
$
435,626
$
32,265
$
(2,032
)
$
2,296,662
Billable costs
172,490
11,473
93,899
267,439
–
(747
)
544,554
Revenue
1,077,607
335,656
695,402
703,065
32,265
(2,779
)
2,841,216
Billable costs
172,490
11,473
93,899
267,439
–
(747
)
544,554
Staff costs
557,776
227,522
356,684
232,096
28,686
46,942
1,449,706
Administrative costs
101,145
21,809
83,572
47,335
9,777
11,408
275,046
Unbillable and other costs, net
70,924
1,393
65,188
10,840
6,117
–
154,462
Adjusted EBITDA(1)
175,272
73,459
96,059
145,355
(12,315
)
(60,382
)
417,448
Stock-based compensation
17,095
6,622
6,265
7,721
805
13,653
52,161
Depreciation and amortization
53,106
22,398
31,450
20,100
12,502
12,096
151,652
Deferred acquisition consideration
5,379
7,911
(7,745
)
18,770
(1,320
)
–
22,995
Impairment and other losses
1,500
–
–
–
–
215
1,715
Other items, net(1)
20,251
3,090
17,103
4,860
629
9,924
55,857
Operating income (loss)
$
77,941
$
33,438
$
48,986
$
93,904
$
(24,931
)
$
(96,270
)
$
133,068
(1) See Non-GAAP Financial Measures section above for the definition of Adjusted EBITDA and Other items, net.
SCHEDULE 8 STAGWELL INC. UNAUDITED RECONCILIATION OF ADJUSTED DILUTED EARNINGS PER SHARE (NON-GAAP MEASURE) (amounts in thousands, except per share amounts)
For the Three Months Ended December 31, 2025
GAAP
Adjustments
Non-GAAP
Net income attributable to Stagwell Inc. common shareholders and adjusted net income
$
12,660
$
64,037
$
76,697
Diluted – Weighted average number of shares outstanding
258,997
–
258,997
Diluted EPS and Adjusted Diluted EPS (1)
$
0.05
$
0.30
Adjustments to Net income
Amortization
$
38,333
Stock-based compensation
9,953
Deferred acquisition consideration
2,444
Other items, net
16,639
67,369
Adjusted tax expense
(3,332
)
$
64,037
(1) See Non-GAAP Financial Measures section above for the definition of Adjusted Diluted EPS.
SCHEDULE 9 STAGWELL INC. UNAUDITED RECONCILIATION OF ADJUSTED DILUTED EARNINGS PER SHARE (NON-GAAP MEASURE) (amounts in thousands, except per share amounts)
For the Year Ended December 31, 2025
GAAP
Adjustments
Non-GAAP
Net income attributable to Stagwell Inc. common shareholders
$
29,101
$
198,129
$
227,230
Net loss attributable to Class C shareholders
(6,637
)
–
(6,637
)
Net income attributable to Stagwell Inc. and Class C shareholders and adjusted net income
$
22,464
$
198,129
$
220,593
Diluted – Weighted average number of common shares outstanding
225,468
–
225,468
Weighted average number of shares of Class C Common Stock outstanding
39,055
–
39,055
Diluted – Weighted average number of shares outstanding
264,523
–
264,523
Diluted EPS and Adjusted Diluted EPS (1)
$
0.08
$
0.83
Adjustments to Net Income
Amortization
$
145,506
Impairment and other losses
466
Stock-based compensation
54,095
Deferred acquisition consideration
(7,467
)
Other items, net
46,792
239,392
Adjusted tax expense
(41,263
)
$
198,129
(1) See Non-GAAP Financial Measures section above for the definition of Adjusted Diluted EPS.
SCHEDULE 10 STAGWELL INC. UNAUDITED RECONCILIATION OF ADJUSTED DILUTED EARNINGS PER SHARE (NON-GAAP MEASURE) (amounts in thousands, except per share amounts)
For the Three Months Ended December 31, 2024
GAAP
Adjustments
Non-GAAP
Net income attributable to Stagwell Inc. common shareholders
$
3,235
$
22,778
$
26,013
Net income attributable to Class C shareholders
–
41,549
41,549
Net income attributable to Stagwell Inc. and Class C and adjusted net income
$
3,235
$
64,327
$
67,562
Diluted – Weighted average number of common shares outstanding
115,147
–
115,147
Weighted average number of shares of Class C Common Stock outstanding
–
151,649
151,649
Diluted – Weighted average number of shares outstanding
115,147
151,649
266,796
Diluted EPS and Adjusted Diluted EPS (1)
$
0.03
$
0.25
Adjustments to Net income
Amortization
$
30,572
Stock-based compensation
13,235
Deferred acquisition consideration
15,045
Other items, net
14,799
73,651
Adjusted tax expense
(20,618
)
53,033
Net income attributable to Class C shareholders
11,294
$
64,327
Allocation of adjustments to Net income
Net income attributable to Stagwell Inc. common shareholders
$
22,778
Net income attributable to Class C shareholders – add-backs
30,255
Net income attributable to Class C shareholders
11,294
41,549
$
64,327
(1) See Non-GAAP Financial Measures section above for the definition of Adjusted Diluted EPS.
SCHEDULE 11 STAGWELL INC. UNAUDITED RECONCILIATION OF ADJUSTED DILUTED EARNINGS PER SHARE (NON-GAAP MEASURE) (amounts in thousands, except per share amounts)
For the Year Ended December 31, 2024
GAAP
Adjustments
Non-GAAP
Net income attributable to Stagwell Inc. common shareholders
$
2,259
$
82,506
$
84,765
Net income attributable to Class C shareholders
–
126,735
126,735
Net income attributable to Stagwell Inc. and Class C shareholders and adjusted net income
$
2,259
$
209,241
$
211,500
Diluted – Weighted average number of common shares outstanding
115,752
–
115,752
Weighted average number of shares of Class C Common Stock outstanding
–
151,649
151,649
Diluted – Weighted average number of shares outstanding
115,752
151,649
267,401
Diluted EPS and Adjusted Diluted EPS (1)
$
0.02
$
0.79
Adjustments to Net income
Amortization
$
122,442
Impairment and other losses
1,715
Stock-based compensation
52,161
Deferred acquisition consideration
22,995
Other items, net
55,857
255,170
Adjusted tax expense
(63,073
)
192,097
Net income attributable to Class C shareholders
17,144
$
209,241
Allocation of adjustments to Net income
Net income attributable to Stagwell Inc. common shareholders
$
82,506
Net income attributable to Class C shareholders – add-backs
109,591
Net income attributable to Class C shareholders
17,144
126,735
$
209,241
(1) See Non-GAAP Financial Measures section above for the definition of Adjusted Diluted EPS.
SCHEDULE 12 STAGWELL INC. UNAUDITED CONSOLIDATED BALANCE SHEETS (amounts in thousands)
December 31, 2025
December 31, 2024
ASSETS
Current Assets
Cash and cash equivalents
$
104,537
$
131,339
Accounts receivable, net
735,752
716,415
Expenditures billable to clients
164,694
173,194
Other current assets
157,309
114,200
Total Current Assets
1,162,292
1,135,148
Fixed assets, net
73,081
72,706
Right-of-use assets – operating leases
213,576
219,400
Goodwill
1,595,238
1,554,146
Other intangible assets, net
834,248
836,783
Deferred tax assets
281,057
46,926
Other assets
55,055
43,112
Total Assets
$
4,214,547
$
3,908,221
LIABILITIES, REDEEMABLE NONCONTROLLING INTERESTS (“RNCI”), AND SHAREHOLDERS’ EQUITY
Current Liabilities
Accounts payable
$
548,320
$
449,347
Accrued media
239,490
245,883
Accruals and other liabilities
291,554
265,356
Advance billings
329,815
294,609
Current portion of lease liabilities – operating leases
55,386
60,195
Current portion of deferred acquisition consideration
15,446
51,906
Total Current Liabilities
1,480,011
1,367,296
Long-term debt
1,326,013
1,353,624
Long-term portion of deferred acquisition consideration
24,598
50,209
Long-term lease liabilities – operating leases
224,397
245,397
Deferred tax liabilities
54,726
47,239
Long-term tax receivable agreement liability
252,390
25,493
Other liabilities
51,077
33,646
Total Liabilities
3,413,212
3,122,904
Redeemable Noncontrolling Interests
24,968
8,412
Commitments, Contingencies and Guarantees
Shareholders’ Equity
Common shares – Class A
252
115
Common shares – Class C
–
2
Paid-in capital
744,463
343,647
Retained earnings
32,930
11,740
Accumulated other comprehensive loss
(19,252
)
(23,773
)
Stagwell Inc. Shareholders’ Equity
758,393
331,731
Noncontrolling interests
17,974
445,174
Total Shareholders’ Equity
776,367
776,905
Total Liabilities, Redeemable Noncontrolling Interests and Shareholders’ Equity
$
4,214,547
$
3,908,221
SCHEDULE 13 STAGWELL INC. UNAUDITED SUMMARY CASH FLOW DATA (amounts in thousands)
Years Ended December 31,
2025
2024
Cash flows from operating activities:
Net income
$
30,626
$
25,044
Adjustments to reconcile net income to cash provided by operating activities:
Stock-based compensation
54,095
52,161
Depreciation and amortization
171,249
151,652
Amortization of right-of-use lease assets and lease liability interest
67,495
75,117
Impairment and other (gains) losses
(3,116
)
1,715
Deferred income taxes
10,439
(10,686
)
Adjustment to deferred acquisition consideration
(7,467
)
23,005
Loss (gain) on sale of business
2,245
–
Bargain purchase gain
(9,937
)
–
Other, net
7,519
7,622
Changes in working capital:
Accounts receivable
28,787
8,465
Expenditures billable to clients
12,012
(54,350
)
Other current assets
(51,534
)
(6,200
)
Accounts payable
73,573
24,438
Accrued expenses and other liabilities
(42,244
)
(28,658
)
Advance billings
25,574
(22,651
)
Current portion of lease liabilities – operating leases
(76,465
)
(83,905
)
Deferred acquisition related payments
(1,823
)
(19,910
)
Net cash provided by operating activities
291,028
142,859
Cash flows from investing activities:
Capitalized software
(67,489
)
(35,094
)
Capital expenditures
(43,741
)
(18,912
)
Acquisitions, net of cash acquired
(6,179
)
(103,254
)
Proceeds from sale of business, net
10,850
–
Other
(7,119
)
(5,212
)
Net cash used in investing activities
(113,678
)
(162,472
)
Cash flows from financing activities:
Repayment of borrowings under revolving credit facility
(2,026,000
)
(1,755,000
)
Proceeds from borrowings under revolving credit facility
1,999,326
1,960,000
Shares repurchased and cancelled
(134,261
)
(108,249
)
Distributions to noncontrolling interests
(9,662
)
(26,723
)
Payment of deferred consideration
(33,343
)
(29,774
)
Purchase of noncontrolling interest
–
(3,316
)
Debt financing and other costs
(6,077
)
–
Net cash (used in) provided by financing activities
(210,017
)
36,938
Effect of exchange rate changes on cash and cash equivalents
5,865
(5,723
)
Net increase (decrease) in cash and cash equivalents
ROYERSFORD, PA – March 09, 2026 – PRESSADVANTAGE –
Beacon of Life Chiropractic highlights the professional background of Dr. Megan McClimon, one of its co-founders, who brings experience from leading chiropractic offices in the Southeast United States to the Royersford community. Her path includes academic achievements and leadership roles, emphasizing neurologically-based approaches to spinal health. This focus supports the practice’s delivery of natural methods for musculoskeletal issues.
Dr. Megan McClimon grew up in Okemos, Michigan, developing an interest in health through sports. She earned a third-degree black belt in Taekwondo and became a National Champion in 2002. This led to a Bachelor of Science in Movement Science from the University of Michigan. Early exposure to chiropractic came via her father’s role with the Michigan Chiropractic Society, and she worked as a chiropractic assistant for seven years. Personal health improvements from such care motivated her professional pursuit.
Dr. McClimon graduated Magna Cum Laude with a Doctorate in Chiropractic from Life University in Georgia. Her education centered on neurologically-based care, focusing on the nervous system’s health influence. She led two large family-based clinics in the Atlanta area for two years, applying scientific techniques.
In Pennsylvania, Dr. McClimon co-founded Beacon of Life Chiropractic with Dr. Daniel McClimon. The practice provides spinal adjustments to realign vertebrae and reduce nerve pressure, addressing back pain, neck discomfort, and headaches. Neurologically-based chiropractic seeks to optimize nervous system function, complementing medical approaches that may use medications or surgery. This philosophy views the nervous system as central, while recognizing chiropractic as complementary with varying evidence support.
Systematic reviews indicate spinal manipulation therapy’s effectiveness for spine pain. A review in the Journal of Orthopaedic & Sports Physical Therapy found most procedures equal to guideline interventions and slightly more effective than others. Another in Frontiers in Neurology showed increased corticomotor excitability in lower limb muscles post-adjustment in chronic stroke patients. A Nature Scientific Reports study reported strength increases in weak muscles after a single session in stroke patients. For low back pain, a BMJ meta-analysis noted small effects for short-term relief compared to non-recommended therapies. A JAMA review associated manipulation with modest improvements in acute low back pain. A Spine Journal meta-analysis showed manipulation reduced pain and disability versus active comparators like exercise. A Cochrane review indicated small pain reduction and moderate function improvement versus sham.
Patient outcomes data reflect these findings. A JAMA Network Open study found moderate short-term improvements in low back pain intensity and disability when chiropractic added to medical care. Satisfaction surveys show higher ratings for chiropractic than medical care for back pain. A PMC article noted patients nearly twice as likely satisfied with chiropractic versus medical doctors.
Individual cases at Beacon of Life Chiropractic serve as examples, distinct from evidence-based data. One patient regained hand function through adjustments and SoftWave therapy, improving work ability. Another with chronic issues restored mobility for family activities. A neuropathy patient reported life improvements. These anecdotes illustrate potential experiences, while outcomes vary; coordination with medical professionals is advised.
The team includes chiropractors with varied backgrounds. Dr. Diana Harkness transitioned after Lyme Disease challenges, informed by athletic training. Dr. Benjamin Linkel applies seven years in pain relief, drawing from exercise physiology. Support staff handle operations, therapies, and education.
Beacon of Life Chiropractic uses techniques for migraines, carpal tunnel, and sports injuries. Adjustments alleviate nerve pressure; therapies like acoustic waves reduce inflammation. Wellness programs address posture, immune function, and energy via prevention.
“Neurologically-based care complements other approaches by promoting natural recovery through nervous system optimization,” said Dr. Megan McClimon, co-founder and chiropractor at Beacon of Life Chiropractic.
The practice develops tailored plans via evaluations, prioritizing non-invasive methods. Staff certifications in massage and counseling enhance services.
“Integrating evidence with chiropractic principles supports patient well-being,” said Dr. Daniel McClimon, co-founder and chiropractor at Beacon of Life Chiropractic.
Beacon of Life Chiropractic serves as a resource for pain relief from injuries or chronic conditions. The structure facilitates assessments and support, aiding community health.
Founded by Dr. Megan McClimon and Dr. Daniel McClimon, the practice offers adjustments, therapy, and resources for conditions. It emphasizes patient-centered methods leveraging healing abilities.
This highlight of Dr. McClimon’s background underscores informed care dedication. Her journey demonstrates applied knowledge in operations.
Beacon of Life Chiropractic provides services in Royersford, Pennsylvania, addressing musculoskeletal concerns naturally.
###
For more information about Beacon of Life Chiropractic, contact the company here:
Beacon of Life Chiropractic Daniel McClimon, DC (610) 474-2481 info@gobeaconhealth.com 70 Buckwalter Rd Ste 412, Royersford, PA 19468
LOS ANGELES, CA – March 09, 2026 – PRESSADVANTAGE –
New California law allows courts to consider gun restriction violations when determining child custody in domestic violence cases. Beginning January 1, 2026, California courts can consider firearm restriction violations when making child custody decisions in divorce cases involving domestic violence, according to Charles M. Green, APLC, a Los Angeles family law firm. The amendment to Family Code §3044 gives judges another tool to evaluate whether a parent poses a risk to children—and creates new legal consequences for those who fail to comply with gun surrender orders.
The change comes as domestic violence continues to affect families across Los Angeles County, where an average of 36 intimate partner violence-related homicides occur each year. According to the Los Angeles County Department of Public Health, 20 percent of women and 13 percent of men in the county report being physically or sexually abused by an intimate partner. Nationally, approximately 847,000 cases of intimate partner violence against victims age 12 and older are reported annually.
Under the updated law, a parent’s illegal access to firearms—including possession that violates restraining orders, probation conditions, or state and federal statutes—can now directly influence custody outcomes. Courts already presume against granting custody to a parent who has committed domestic violence. The new provision strengthens that presumption by treating firearm violations as evidence of ongoing risk.
“A parent who violates a firearm restriction during a custody case isn’t just facing criminal charges—they’re handing the other side a powerful argument for sole custody,” said Charles M. Green, a Certified California Family Law Specialist and licensed CPA with 27 years of experience in California divorce proceedings.
The law also works in conjunction with other recent legislative changes. Assembly Bill 2759, effective January 2025, requires immediate surrender of all firearms and ammunition when a domestic violence protective order is issued. Courts are now required to search the Department of Justice Automated Firearms System before issuing or denying protective orders—meaning violations are more likely to be discovered and documented. Assembly Bill 2308, also effective January 2025, extended the maximum duration of domestic violence restraining orders from five years to ten years, with the possibility of permanent orders in certain cases.
For parents navigating child custody disputes where domestic violence is alleged, compliance with firearm restrictions has become a critical factor in case strategy. A single violation—even one that does not result in criminal prosecution—can now be cited as grounds to deny custody or reduce parenting time. The burden falls on the accused parent to demonstrate that granting custody would be in the child’s best interest.
“If you’re going through a divorce involving domestic violence allegations, the first thing you need to do is understand exactly what firearm restrictions apply to you—and follow them to the letter,” Green added. “The court isn’t going to give you the benefit of the doubt. Compliance is everything.”
The intersection of firearm law and family law reflects California’s broader legislative focus on child safety in custody proceedings. Piqui’s Law, enacted in 2023, already restricts reunification programs that place children with parents who have histories of abuse. The firearm provision adds another layer of protection by ensuring that violations of gun restrictions carry consequences beyond criminal penalties.
Parents facing custody disputes involving domestic violence allegations should consult with an experienced family law attorney to understand how these new laws may affect their case. Early legal guidance can help protect parental rights while ensuring full compliance with court orders and statutory requirements.
###
For more information about Charles M. Green, APLC, contact the company here:
Charles M. Green, APLC Charles M. Green 213-387-4508 miguel@greenlawcorp.com 3699 Wilshire Blvd Ste 700 Los Angeles, CA 90010
The team behind American Print and Supply unveils SuperGamut, signaling a new phase focused on integrated DTF ecosystems, service and future industry expansion.
As the DTF industry continues to evolve, we felt it was the right time to rebrand in a way that more accurately reflects our mission of providing true ‘white-glove’ service to our customers.”
— Rob Super
EAST PEORIA, IL, UNITED STATES, March 9, 2026 /EINPresswire.com/ — One of the apparel decoration industry’s most recognized DTF teams has officially stepped into a larger spotlight with a strategic rebrand. SuperGamut has launched as the new identity for the business formerly known as American Print and Supply, signaling an expanded focus on delivering complete digital production ecosystems for garment decorators.
The new brand has already begun appearing across the industry. SuperGamut made its first public debut at DAX Kansas City, followed the next week by a second appearance at the APA Expo in Las Vegas, marking the company’s first trade show presence under the new name. The transition is now fully underway, with the company’s website already updated and social media channels gradually shifting to the new SuperGamut brand identity.
SuperGamut represents the next evolution of the business, reflecting a clearer vision for how modern digital production systems should be designed, supported, and delivered to apparel decorators.
According to Rob Super, CEO and President, the new name better reflects the company’s long-term strategy and service philosophy.
“As the DTF industry continues to evolve, we felt it was the right time to rebrand in a way that more accurately reflects our mission of providing true ‘white-glove’ service to our customers,” said Super. “Not only do we offer the full gamut of DTF solutions, but our systems are also designed to deliver expanded color gamuts, giving decorators greater performance and versatility.”
Under the SuperGamut brand, the company will continue to focus on fully integrated DTF production systems that combine hardware, consumables, workflow software, and technical support into cohesive solutions designed to simplify digital garment production.
SuperGamut is also the newest company to join the Super Print Collection holding company, which is expected to expand further in the coming months. According to the company, additional announcements—including strategic acquisitions and the launch of new companies within the group—are anticipated in the near future.
Dan Barefoot
WIN Media and News Network
+1 818-679-8075 email us here
Legal Disclaimer:
EIN Presswire provides this news content “as is” without warranty of any kind. We do not accept any responsibility or liability
for the accuracy, content, images, videos, licenses, completeness, legality, or reliability of the information contained in this
article. If you have any complaints or copyright issues related to this article, kindly contact the author above.
Top ranked fighters from around the world headline 500+ competitors across 27 tournaments at the world’s largest Historical European Martial Arts event.
POMONA, CA, UNITED STATES, March 9, 2026 /EINPresswire.com/ — SoCal Swordfight 2026, the world’s largest Historical European Martial Arts (HEMA) event, will return to the Sheraton Fairplex in Pomona with more fighters, more tournaments, and more international talent than ever before. Organizers report over 730 registered attendees as of March 5, 2026, with total attendance projected to exceed 1,200, marking the event’s fourth consecutive year with over 1,000 attendees.
SoCal Swordfight 2026 will bring together 504 fighters, with over 700 attendees already registered, representing 145 schools from across the United States and around the world. Fighters are traveling from 7 countries (including the USA, Canada, Finland, Mexico, Poland, Sweden, and the United Kingdom/Scotland) and 39 U.S. states and territories, ranging from Alaska and Hawaii to New York and Puerto Rico.
Elite competition and growing divisions
The 2026 edition features 27 tournament across multiple weapon sets, tiers, and divisions, headlined by the Jason Taylor Memorial Open Longsword with 370 registrations, up 10.8% from 2025. Other rapidly growing events include Open Saber (197 registrations, +19.4%) and Open Single Rapier (131 registrations, +42.4%). This year also introduces the Castille Armory Dual Sidesword tournament, the Experimental Tournament for 2026, that has drawn 129 registrations.
SoCal Swordfight continues to emphasize accessibility and competitive depth, with Open Longsword fighters distributed across four tiers (A, B, C, and unrated) and robust participation in URG (underrepresented genders) and U18 (ages 13-17) divisions.
World‑ranked fighters in multiple weapons
Per HEMA Ratings, the sport’s official international ranking system, SoCal Swordfight 2026 features multiple world top‑ranked fighters across several weapons.
Confirmed notable competitors include:
• Robert Childs (Black Tigers) – World #1 in Single Rapier
• Iris Garcia (Lonin League) – World #1 in URG Longsword
• Miro Lahtela (EHMS, Finland) – World #3 in Open Longsword
• Aleksander Dynarek (Mordschlag Łódź) – World #3 in Rapier & Dagger
• Stevi Parker (Bucks Historical Longsword) – World #6 in URG Longsword
• Rashelle DeBolt (Noble Science Academy) – World #8 in URG Longsword and #10 in URG Saber
• Reese Pollock (Comox Valley Combat Guild) – World #10 in Rapier & Dagger
• Arthur Henry (Sacramento Historical Fencing Academy) – World #11 in Rapier & Dagger
• Zachary Showalter (Scuffletown) – World #13 in Open Longsword
• Brittany Reeves (Mordhau) – World #24 in URG Saber
• Kristofer Stanson (Stigmän) – World #24 in Single Rapier
Many of these athletes are part of a broader roster of 75+ confirmed instructors and internationally ranked competitors offering classes, coaching, and high‑level competition over three days.
Event highlights and schedule
Across the weekend, SoCal Swordfight will offer 140+ hours of workshops and classes led by more than 75 international instructors, covering historical longsword, rapier, saber, dagger, wrestling, and related European martial arts.
Key public highlights include:
• Thursday Evening Reception – March 19, 2026 (ideal for pre‑event media interviews and feature profiles)
• Antique Weapons Showcase – Saturday, March 21, 6–8 PM (historic swords and arms on display for attendees and media)
• Vendor Hall – All weekend, featuring HEMA equipment makers, sword artisans, and gear manufacturers
• Championship Sunday Finals – Sunday, March 22, 6–8 PM (marquee finals in multiple divisions, ideal for broadcast‑ready footage)
Past attendees describe SoCal Swordfight as “the premier West Coast tournament, if not the premier global tournament” and “the best event in the world at this point,” praising its scale, inclusivity, and the consistently high level of competition.
Event Details
What – SoCal Swordfight 2026 — World’s Largest HEMA Tournament
When – March 20-22, 2026
Where – Sheraton Fairplex, 601 W McKinley Ave, Pomona, CA 91768
Tickets – socalswordfight.com
EIN Presswire provides this news content “as is” without warranty of any kind. We do not accept any responsibility or liability
for the accuracy, content, images, videos, licenses, completeness, legality, or reliability of the information contained in this
article. If you have any complaints or copyright issues related to this article, kindly contact the author above.
Following its Bogotá debut, the official Colombian National Team fan community expands to Miami with an exclusive event.
MIAMI, FL, UNITED STATES, March 9, 2026 /EINPresswire.com/ — Following its official presentation in Bogotá, El Club de La Sele continues its international expansion with an exclusive launch event in Miami Beach, reinforcing the global reach of the official community of Colombian National Team supporters.
On Thursday, March 5, the city hosted a special launch cocktail attended by special guests and select media, marking the beginning of a new chapter that connects Colombian fans both inside and outside the country through a shared passion for soccer.
The event took place at Andrés Carne de Res Miami, located at 455 Lincoln Road, Miami Beach, FL 33139. The gathering reflected the spirit of the original launch in Bogotá and symbolized the growth of a community designed to celebrate Colombian soccer without borders.
El Club de La Sele is the official space that brings supporters together to share the emotion inspired by Colombia’s national colors. The initiative aims to strengthen the bond between the Colombian National Team and its global fan base through exclusive experiences, special benefits, and official gathering points in cities around the world.
“With El Club de La Sele we take a firm step toward bringing La Sele even closer to those who truly make it great: its fans. This community will grow every day and will allow us to experience soccer in a closer, more joyful and more authentic way in every corner of the country and around the world,” said Ramón Jesurun, President of the Colombian Football Federation.
The community is built on a clear mission: to become the club where everyone who feels the passion for La Sele belongs. It welcomes supporters of both the men’s and women’s national teams across youth and senior categories, as well as Futsal and Beach Soccer.
The launch in Miami represents the first major international milestone following the inaugural event in Bogotá and strengthens the network of official venues, businesses, and fans united around a shared experience.
El Club de La Sele operates through four main pillars:
Members
Fans can purchase memberships that provide access to exclusive experiences, prizes, signed merchandise, discounts with partner brands, and special benefits at accredited Embassies worldwide.
Embassies
Restaurants, bars, and nightclubs can become certified official locations to watch matches, activate authorized fan experiences, and offer exclusive benefits to supporters.
WhatsApp Direct Line
An official channel for Members and Embassies providing information, benefits, experiences, and geolocation of accredited venues.
Partner Brand Benefits
Integration of official benefits from partner brands that expand the experience for Members both inside and outside official venues.
Starting today, fans and establishments can register at www.elclubdelasele.com and officially join this growing global community.
About El Club de La Sele
El Club de La Sele is the official fan community of the Colombian National Team, designed to unite supporters around the world through exclusive experiences, benefits, and official gathering spaces that celebrate the passion for Colombian soccer.
Media Contact
Communications | El Club de La Sele
info@elclubdelasele.com
+57 318 131 5807
EIN Presswire provides this news content “as is” without warranty of any kind. We do not accept any responsibility or liability
for the accuracy, content, images, videos, licenses, completeness, legality, or reliability of the information contained in this
article. If you have any complaints or copyright issues related to this article, kindly contact the author above.
“Code Match” Lights Up the Exosphere – The World’s Largest LED Screen – With 16 Chances to Win “Only in Las Vegas” Prizes
LAS VEGAS, NV, UNITED STATES, March 9, 2026 /EINPresswire.com/ — Visit Las Vegas announced today “Code Match,” an innovative, live digital sweepstakes that transforms the Exosphere of Sphere in Las Vegas, the world’s largest LED screen, into a first-of-its-kind mobile game experience. Up for grabs are 16 unique, “Only in Las Vegas” prizes that will be awarded to lucky code matchers. The game begins on Friday, March 13 at 7 p.m. PT/10 p.m. ET, and is open to U.S. residents aged 21 and over, who can register now at CodeMatch.com for their chance to win. Press assets available here.
Created by Sphere Studios, this first‑of‑its‑kind mobile game will give participants the chance to win exclusive Vegas prize packages, including tickets to both The Wizard of Oz at Sphere and No Doubt Live at Sphere, plus luxury accommodations, VIP nightlife access, celebrity chef dining, spa escapes, behind‑the‑scenes venue tours, and marquee entertainment and sporting experiences.
“Only Las Vegas would look at the world’s most iconic canvas and say, ‘Let’s raise the stakes.’ Code Match transforms the Exosphere into a playful, engaging experience, inviting fans to discover unforgettable Las Vegas experiences all powered by that unmistakable “Only in Vegas” spark that defines the destination,” said Kate Wik, Chief Marketing Officer for Visit Las Vegas.
“This collaboration with Visit Las Vegas underscores our shared commitment to delivering the type of unforgettable experiences that Las Vegas is known for,” said Marcus Ellington, EVP, Ad Sales and Sponsorships, Sphere. “By transforming the Exosphere into a mobile game experience, we continue to push the boundaries of how our advanced technologies can enable fans to connect with brands on the Exosphere.”
How It Works
Registration is now open at CodeMatch.com, where participants can opt in to play for any, or all, of the 16 rounds – each of which features a distinct prize package. Code Match will go live on the Exosphere—and on CodeMatch.com—at 7 p.m. PT / 10 p.m. ET on Friday, March 13.
The game will be played on CodeMatch.com and viewable in real-time on the Exosphere. During each round, a custom animation will reveal a three-digit number on the Exosphere. If an eligible participant’s randomly assigned code matches the number displayed for that round, they have the winning code. New rounds will launch every 8 minutes, with a new winning three-digit code revealed each round. Players will be assigned random codes on CodeMatch.com for each round they opt to play. All prize packages are for two people and include airfare credit, as further detailed in the official rules.
The “Only in Las Vegas” prizes available to win in Code Match include:
– Bad Witch Weekend: Two tickets for The Wizard of Oz at Sphere as part of the Bad Witch package, which includes premium seating; access to the Delta SKY360° Club with complimentary themed food and beverage; expedited entry and limited-edition poster. The winner and a guest will also enjoy a two-night stay at The Venetian Resort Las Vegas and dinner for two at one of the resort’s signature restaurants.
– Caesars VIP Getaway: Celebrate the Diamond Anniversary of Caesars Palace Las Vegas with two VIP tickets to the hotel’s Anniversary Celebration (date to be determined), dinner for two at Michelin award-winning Restaurant Guy Savoy, a VIP cabana for two with food and beverage credit at the Garden of the Gods Pool Oasis and a two‑night stay in a Colosseum Tower suite at Caesars Palace.
– F1 Exclusive Weekend: One of the most exciting events of the year is the Formula One Heineken Las Vegas Grand Prix. The winner and a guest will get to experience the high-octane energy for themselves by attending the LVGP in 2026 with two grandstand tickets, a guided Paddock tour for behind-the-scenes views and a pitlane walk experience to get up close to the teams and cars. Plus, a two‑night stay at a select Las Vegas resort.
– Green Valley Ranch Getaway: Enjoy a two‑night stay in a Strip suite at the recently remodeled Green Valley Ranch Resort, dinner at Hank’s Fine Steaks & Martinis, learn from the best with a VIP table games lesson, and a luxury couples’ massage.
– NASCAR Weekend: Get ready to start your engines with Blackjack Club access to the South Point 400 at the Las Vegas Motor Speedway on Oct. 4 with incredible views of the speedway overlooking pit road, pre-race track passes for the pre-race experience, reserved seat at the Drivers Meeting garage tour and more. And don’t worry about how you’ll get there; we’ve got it covered with round‑trip helicopter transfers from the Strip via Maverick Helicopters plus a two‑night stay at a select Las Vegas resort.
– New Year’s Eve Getaway: Las Vegas’ New Year’s Eve celebrations are unrivaled, and one lucky winner will have a chance to help creatively direct America’s Party fireworks by helping to select the countdown song and a drone‑show graphic. The winner and a guest will attend a premium New Year’s Eve party to watch in style with a two‐night resort stay.
– No Doubt Getaway: One winner and their guest will receive two premium concert tickets for No Doubt Live at Sphere and a two-night stay and a food and beverage credit at The Venetian Resort Las Vegas.
– Palms VIP Weekend: Rest your head with a two-night stay in the famed Cinema Suite with 24-hour butler service at Palms, a VIP table at Ghostbar with rooftop views of Las Vegas, and enjoy mouth-watering delicacies courtesy of Tim Ho Wan’s Dim Sum Specialists.
– Resorts World Weekend: Live your best life with a two‑night stay in a Conrad Las Vegas suite, a VIP dining experience at Stubborn Seed by Michelin Star Chef Jeremy Ford, and a VIP table experience at Zouk Nightclub.
– Rodeo Weekend: Ride ‘em cowboy. Attend one of Las Vegas’ biggest events of the year, National Finals Rodeo (NFR), with two VIP Platform seats near the announcers, a meet and greet with the singer of the National Anthem and opening act, and receive a private tour of the NFR grounds.
– SAHARA Grand Escape: Let your hair down with a weekend at SAHARA Las Vegas with a Magic Mike Live VIP experience, dinner at Balla Italian Soul, Amina Spa treatments, VIP table at CASBAR Lounge during Dueling Pianos, and a two‑night stay in a SAHARA Suite with VIP airport transfers.
– Spiegelworld Weekend: How would the Gazillionaire do Las Vegas? Find out for yourself with a Superfrico chef’s tasting, VIP tickets to Absinthe at Caesars Palace, luxury Gazillac transportation, and a two‑night stay at a Las Vegas resort.
– TAO Beach Getaway: It’s never too early to think about pool season. One winner will receive a VIP Table with a DJ meet‑and‑greet at TAO Beach, along with a two‑night stay at The Venetian Resort Las Vegas and dinner for two at TAO Asian Bistro.
– UFC Fight Week: Get a chance to live out your MMA fantasies with VIP Tickets to a UFC numbered event with Post-Fight Octagon Experience, reserved access at ceremonial weigh-ins, UFC athlete meet & greet, UFC HQ and UFC Performance Institute Tour, and a two-night stay at a Las Vegas resort.
– Ultimate Circa Sports Weekend: For sports fans, nothing can beat a weekend at Circa Resort & Casino with a two-night stay in a Circa Suite, a cabana at Stadium Swim, and dinner for two at Barry’s Downtown Prime.
– Wynn Spa Weekend: Pamper yourself at the Forbes five‑star spas of Wynn Las Vegas and Encore Las Vegas, dinner at an award‑winning restaurant, tickets to “Awakening” followed by a meet & greet experience, and a two-night stay in a Tower Suite Parlor at Wynn or Encore.
All prize packages include an airfare credit and are further described in the official rules. To enter and learn more about gameplay, visit CodeMatch.com.
No purchase necessary. See Official Rules at https://codematch.com/rules for details. Open to legal US residents, 21 years of age or older, who have registered for each applicable game period by the cut-off time designated in the Official Rules. Ends 8:59 p.m. PT on March 13, 2026. Void where prohibited.
ABOUT THE LVCVA
The Las Vegas Convention and Visitors Authority (LVCVA) is charged with positioning Southern Nevada as the undisputed global destination for leisure and business travel and operates the 4.6 million‑square‑foot Las Vegas Convention Center (LVCC). With 150,000 hotel rooms and nearly 15 million square feet of meeting and exhibit space, the LVCVA’s mission centers on attracting visitors to the area. The LVCVA also owns the Vegas Loop at the Las Vegas Convention Center, designed and operated by The Boring Company, and the Las Vegas Monorail, an elevated 3.9‑mile system with seven stops throughout the resort corridor. For more information, visit LVCVA.com, VisitLasVegas.com, or VegasMeansBusiness.com.
ABOUT SPHERE
Sphere is an experiential medium that is redefining the future of immersive experiences. Powered by advanced technologies that ignite the senses, Sphere is a venue where the foremost artists, creators, and technologists create extraordinary experiences that bring storytelling to a new level and transport audiences to places both real and imagined. The venue hosts original Sphere Experiences from leading Hollywood creatives; concerts and residencies from the world’s biggest artists; and premier brand events. The first Sphere opened in Las Vegas, with a second venue planned for Abu Dhabi. More information is available at thesphere.com
EIN Presswire provides this news content “as is” without warranty of any kind. We do not accept any responsibility or liability
for the accuracy, content, images, videos, licenses, completeness, legality, or reliability of the information contained in this
article. If you have any complaints or copyright issues related to this article, kindly contact the author above.
MAGNOLIA, MS, UNITED STATES, March 9, 2026 /EINPresswire.com/ — When equipment fails, industries don’t dial Ghostbusters; instead they call Tommy D. Jones. Known as a Global Reliability Leader and a subject matter expert in lubrication and hydraulic systems, Jones has navigated the world’s largest manufacturing landscapes, preventing catastrophic downtime and saving over $1 billion for his employers. His story, humor, and relentless pursuit of problem-solving have made him a legend in an industry not always associated with excitement or big personalities.
Now, as he prepares to retire and share his strategies with the world, Jones is ready to unveil what it means to be the “victim of success” and why building a legacy of reliability is more than just checking a box.
The Pressure of Knowing Everything (and Admitting When You Don’t)
For Tommy D. Jones, being a subject matter expert means more than just having the answers—it means knowing when “I don’t know” is the first step toward a solution. “My job title instills into my colleagues that I have all the answers. The reality is, I do, but sometimes my answer is, ‘I don’t know.’ And I’m okay sharing that,” Jones quips.
He notes, with a smile, that while other engineers can defer outside their specialty, his “master of all trades and jack of none” approach to hydraulics and lubrication means he is the last line of defense. From mechanical to electrical, process control to chemistry, he covers it all: “The world of hydraulics forces you to be that way.”
Rethinking the Status Quo: From Shutdown to Run Strategies
Jones has championed a new mindset in reliability; what he calls the “run strategy.” Traditionally, industries rely on hardwired shutdowns triggered by switches for low pressure, high temperature, or low flow events. “It’s like driving your car off a cliff without time to hit the brakes,” he explains.
He compares his Run Strategy approach to rumble strips on the highway. “Deviation alarms are like those bumps on the road that keep you in your lane.” By adding instrumentation and deviation alarms, he helps facilities avoid sudden failures, allowing gentle course corrections long before disaster strikes. The result? Systems that once led the pack in downtime are now trouble-free, and plant managers can finally catch a ballgame or a birthday dinner without fear of midnight emergencies.
With over 150 facilities in his care worldwide, Jones has become something of an industry myth. “I tell people I’m like Bigfoot. You will hear a lot about me but won’t see me all that much,” he jokes. Yet, the role comes with its challenges: “If my job title were ‘Reliability Implementation Manager’ instead of ‘Subject Matter Expert,’ maybe I’d spend less time putting out fires and more time preventing them.”
His record speaks for itself. “Since 2010, I’ve saved over $1 billion in downtime,” he reports, “My greatest frustration is that my expertise is usually called in after the wheels have come off.” If the facilities had followed previous Run Strategy recommendations the failures would not occur.
A Career Built on Curiosity (and Divine Intervention)
Jones’ journey into hydraulics began in 1983, thanks to what he calls “divine intervention.” Certifications in fluid power, years of experience in offshore, military, steel, and paper industries, and a relentless drive to master every facet of his craft have built him into the rare expert who can take a system from concept to troubleshooting.
He’s quick to point out that there’s no college degree for hydraulics. “You just have to get into the field. Most people don’t even know it exists!” His advice to the next generation? “If you don’t know what you want to be when you grow up, get into hydraulics.”
Turning Down Tesla (and Why Tranquility Is Priceless)
In a plot twist worthy of Hollywood, Jones once turned down an offer from Tesla. Yes, that Tesla. “They needed help with lube and hydraulic systems, but wanted me to move to Austin. I live on a 100-acre farm with my grandchildren. There’s no price tag on tranquility.” Even a $400,000 salary, free housing, and unlimited time off couldn’t sway him.
His presentation to Tesla’s top engineers was classic Jones: “Tire pressure matters most. Low, you wear out the edges. High, you wear out the middle. Deviation alarms keep you in the sweet spot.” Sometimes, the simplest solutions require the deepest expertise.
The Next Chapter: From Industry Lifeline to Author and Consultant
As Tommy D. Jones readies for retirement, he’s not riding off quietly. He’s writing a book, “Victim of Success,” to share his hard-earned wisdom, such as how smart decisions with bad data can still lead to disaster and why preventing failures upstream financially outperforms heroic rescues every time.
He’s also set to consult, helping companies everywhere move from knee-jerk reactions to strategies that keep people, profits, and most importantly, reputations intact. As silver-haired experts retire in droves and apprentices climb the ladder too fast, Jones’ legacy is clear: wisdom listens, experience matters, and tranquility is worth more than gold.
About Tommy D. Jones
Tommy D. Jones is a Global Reliability Leader, lubrication and hydraulic systems subject matter expert, who was recently inducted as a Marquis Top Executive by Who’s Who of America. Over a 40-year career, he has supported more than 400 facilities worldwide, saved billions in downtime, and become the go-to problem solver for industries hungry for answers
Close Up Radio recently featured Tommy D. Jones, Global Reliability Leader and Lubrication and Hydraulic Subject Matter Expert in an interview with Doug Llewelyn on Tuesday March 3rd at 10am EST
For speaking or consulting engagements, reach out to Tommy at tdj1.jones@gmail.com.
Lou Ceparano
Close Up Television & Radio
+1 631-850-3314 email us here
Visit us on social media: Facebook
Legal Disclaimer:
EIN Presswire provides this news content “as is” without warranty of any kind. We do not accept any responsibility or liability
for the accuracy, content, images, videos, licenses, completeness, legality, or reliability of the information contained in this
article. If you have any complaints or copyright issues related to this article, kindly contact the author above.
Brand Voice–powered image generation brings organizational values, color palettes, and dignity into every visual.
When every image already reflects your brand, your values, and the communities you serve, your whole team creates with confidence, and leadership spends less time reviewing and more time leading.”
— Scott Eggert – Founder, GoldenDoodle AI
SACRAMENTO, CA, UNITED STATES, March 9, 2026 /EINPresswire.com/ — GoldenDoodle AI, the first trauma-informed artificial intelligence platform for mission-driven organizations, today announced the launch of image generation. The new capability extends GoldenDoodle’s Brand Voice system into visual content, ensuring that every image a team produces reflects the same values, color palette, and audience awareness as the words they write.
The Problem: Generic AI Visuals Don’t Serve Mission-Driven Work
Communications teams, especially nonprofits and healthcare organizations, face a familiar challenge with AI image tools: the output looks like stock photography. It doesn’t carry the organization’s brand or reflect the communities being served. And without a designer or detailed prompt, there’s no reliable way to get it right, which means executive directors and communications lose valuable time and bandwidth creating consistent visuals.
GoldenDoodle’s image generation solves this by connecting directly to the organization’s Brand Voice profile: the same system already ensuring consistent, trauma-informed text across every content mode. When Brand Voice controls the output, the whole team creates with confidence and requires less executive oversight.
How It Works: Brand Voice Meets Image Generation
When a team member generates an image with a Brand Voice selected, GoldenDoodle’s AI agent reads the prompt alongside the organization’s full Brand Voice profile before a single pixel is produced.
That profile now spans 36 dimensions of brand voice, including 9 dedicated visual identity dimensions:
– Brand colors and color palette
– Logo guidance
– Visual style and aesthetic preferences
– Photography direction
– Preferred image tone
– Visual trauma guardrails
– Affirmative image direction
– Demographic Representation Guidance
– Cultural Sensitivity Notes
The agent rewrites the team member’s input into a more intentional prompt and sends that refined version to generate the image. The result is on-brand visual content that reflects the dignity of the people an organization serves—without requiring a designer or a detailed prompt every time.
Across a full campaign or social feed, the effect compounds. Brand colors appear naturally in clothing, backgrounds, and design elements. Visual identity stays coherent and immediately recognizable. GoldenDoodle’s Brand Voice agent provides best-practice suggestions as a starting point, and organizations retain full control to define what representation looks like for their work.
“Your brand voice should show up everywhere, not just in your copy,” said Scott Eggert, Founder and CEO of GoldenDoodle AI. “When every image already reflects your brand, your values, and the communities you serve, your whole team creates with confidence, and leadership spends less time reviewing and more time leading.”
Why This Is Harder Than It Looks
Generating an image is easy. Generating an image that is on-brand, tonally appropriate, representative of the communities an organization serves, and safe for high-stakes communications is an entirely different problem.
AI image models default to a narrow visual vocabulary: the same faces, the same compositions, the same stock-photo aesthetic. Every layer of specificity (e.g., brand colors, photographic style, demographic representation, dignity guardrails) introduces a new point of complexity. Most organizations using generic AI tools hit these limitations quickly and either accept off-brand output or spend hours manually refining prompts.
GoldenDoodle’s approach chains together brand voice matching, prompt rewriting, representation guidance, and dignity filtering into a single generation flow. The platform handles prompt engineering, so the team member doesn’t have to, and leadership can trust that the output reflects the organization’s full 36-dimensional Brand Voice profile from the first image, without reviewing every visual before it goes out the door.
Safety and Dignity by Default
Safety guardrails are built into every image generation request. As with text generation, team members can toggle Brand Voice and trauma-informed filters on or off based on content needs, while operating within GoldenDoodle’s Dignity by Default standard. The platform will not generate images that are obscene, sexual, or otherwise harmful, regardless of how a prompt is written.
“Every image you put in front of your audience is a signal about who you are, who you see, and what you believe is possible,” said Laura Braden, Chief Impact Officer of GoldenDoodle AI. “GoldenDoodle makes sure that signal is intentional and rooted in your values, not a world defined by fear or scarcity.”
Availability Visual identity and image generation are available now as beta features on paid plans. GoldenDoodle AI is actively working with organizations across the nonprofit, healthcare, social services, and advocacy sectors to refine the beta. Full setup guidance is available at goldendoodleai.com/blog/brand-voice-visual-identity-image-generation.
Teams interested in piloting the feature or providing feedback get started with a free 7 day trial at app.goldendoodleai.com.
About GoldenDoodle AI
GoldenDoodle AI is the first and only AI platform architected from the ground up with trauma-informed principles grounded in SAMHSA and APA standards. Purpose-built for nonprofits, community healthcare organizations, and mission-driven teams, GoldenDoodle combines 36-dimension Brand Voice profiles with trauma-informed communication protocols across eight content modes: Email, Social Media, Article, Rewrite, Summarize, Brainstorm, Analyze, and Crisis.
Founded by Scott Eggert (CEO) and Laura Braden (Chief Impact Officer), GoldenDoodle AI is headquartered in Sacramento, California. The platform launched commercially in January 2026.
Website: goldendoodleai.com
Dignity Audit (free website scan): dignityaudit.com
Platform: app.goldendoodleai.com
Pricing: Solo $29/month | Team $39/seat/month
EIN Presswire provides this news content “as is” without warranty of any kind. We do not accept any responsibility or liability
for the accuracy, content, images, videos, licenses, completeness, legality, or reliability of the information contained in this
article. If you have any complaints or copyright issues related to this article, kindly contact the author above.